
the Creative Commons Attribution 4.0 License.
the Creative Commons Attribution 4.0 License.
 | 10 Aug 2026
Technical note: Design, construction, automation, and first-principles calibration of a low volume He measurement line
James R. Metcalf
Rebecca M. Flowers
A noble-gas analysis line capable of accurate and precise measurements of small absolute amounts of 4He released from crystals is a key analytical step in the production of chronologic data. He analysis lines that are custom-built in-house can be optimized for specific lab needs and facilitate continued maintenance, repair, and upgrades. However, there is little information in the published literature about the methods and approaches for building a He line. Here, we describe the design, construction, automation, and metrological calibration of a custom 4He extraction and analysis line as part of establishing laser-ablation methods in the University of Colorado Thermochronology Research and Instrumentation Lab (CU TRaIL). The line, called the Jimbochron, is designed to precisely measure very small (∼ fmol) amounts of 4He while being fully automated and easily modifiable in the future. These goals are achieved by minimizing the line volume, adopting a unique double-hexagonal manifold configuration, installing a high-sensitivity quadrupole mass spectrometer, and developing editable LabView code for instrument communication and automation that is straightforward to update. We also explain the steps used to calibrate the Jimbochron metrologically from first principles with a new in-house calibration volume to ensure high-accuracy He measurements. The Jimbochron accurately and precisely measures small gas amounts (< 0.1 fmol) and now routinely generates accurate and precise He data for laser-ablation applications.
- Article
(5408 KB) - Full-text XML
- BibTeX
- EndNote


chronology is a versatile radiometric dating method based on the accumulation of He in geologic materials produced by the alpha decay of U, Th, and Sm. Calculating a date requires measuring the absolute amounts of both the radiogenic decay isotope (4He) and the radioactive parent isotopes (238U, 235U, 232Th, and 147Sm) present in the material. The precision and accuracy of these measurements are first-order controls on the precision and accuracy of the resulting date. U, Th, and Sm measurements are often performed using inductively-coupled plasma mass spectrometry, which is incapable of measuring noble gases. Therefore, 4He measurements are typically performed using noble gas mass spectrometry, where a gas source mass spectrometer is attached to a vacuum sample extraction line.
Although high-quality noble gas analysis lines are available commercially and can be a good choice for labs seeking to efficiently implement well-established gas measurement methods, these instruments may not be ideal for researchers interested in developing new and emerging techniques. Commercial machines with control software that is proprietary or otherwise inaccessible are not easily modified, customized, and optimized. These limitations can make it difficult and expensive for researchers to innovate and refine analytical approaches as techniques evolve. This restricted flexibility also hinders repairing and replacing hardware components as they fail and complicates updating software and operating systems to maintain compliance with institutional security requirements.
These challenges can be circumvented with He gas analysis lines that are designed and constructed in-house. In 2018, we decided to build a custom He measurement line specifically optimized for laser-ablation in situ He analyses as part of expanding the analytical capabilities of the University of Colorado Thermochronology Research and Instrumentation Lab (CU TRaIL) to include laser-ablation chronology. Theoretically, the He analyses could have been performed on our existing ASI (Australian Scientific Instruments) Alphachron® He analysis line, which has been continuously and reliably producing conventional whole-grain He data for over a decade. However, we do not have the free machine time on the Alphachron® for the experiments required to fully develop new analytical protocols for laser-ablation He analysis. Moreover, the Alphachron's® inaccessible control software makes it difficult to implement new analytical routines with new components (e.g., an excimer laser). Therefore, we designed and constructed a new He analysis line optimized for high-precision, low volume, laser-ablation He analyses, automated the line using custom LabView® software, and calibrated it metrologically using a new in-house calibration volume. To distinguish this He line from the Alphachron®, the new custom line was named the Jimbochron.
Although some labs have personnel with the expertise and skills required to build and commission a He analysis line, little easily accessible information on this topic is available. This creates a situation where valuable information is both difficult to learn and important institutional knowledge can be lost when experienced scientists retire. The geochronology, thermochronology, and mass spectrometry communities benefit from sharing the diverse approaches and methods that can be used to design and calibrate analysis lines, as done in important previous contributions (e.g. Gautheron et al., 2021; Lanphere and Dalrymple, 2000; Lesnek et al., 2024; Morgan et al., 2011; Ritter et al., 2021; Yakubovich et al., 2024). Here, we provide an overview of the steps along our path from deciding to build the Jimbochron to its routine generation of precise and accurate He measurements in the CU TRaIL. Our goal is to share the design principles (Sect. 2), construction information and parts suppliers (Sect. 3), software (Sect. 4), and calibration methods (Sect. 5) necessary to build and commission a He analysis line.
2.1 Design
The primary motivation for the overall physical design of the Jimbochron is to minimize the internal volume of the vacuum line in order to maximize the partial pressure of the small amounts of 4He evolved from laser-ablation pits (often ∼ 1 fmol). The gas evolved from a sample will expand into the available volume, so a smaller expansion volume means a higher He concentration in the line, and therefore a larger He signal at the mass spectrometer. Larger signals are more stable and easier to measure on mass spectrometers. Additionally, smaller volumes are easier to evacuate than larger volumes, which means lower He blanks in the analysis line can be attained more quickly. The arrangement of the main line skeleton influences the total volume that sample gas must expand into because it dictates the total length of stainless-steel tubing required to connect all of the necessary components.
A second important design motivation is a He analysis line that can be modified as easily as possible as the needs of the lab evolve. Such a system allows for future alterations, additions, and improvements without significant deconstruction, recalibration, or re-design of the instrument.
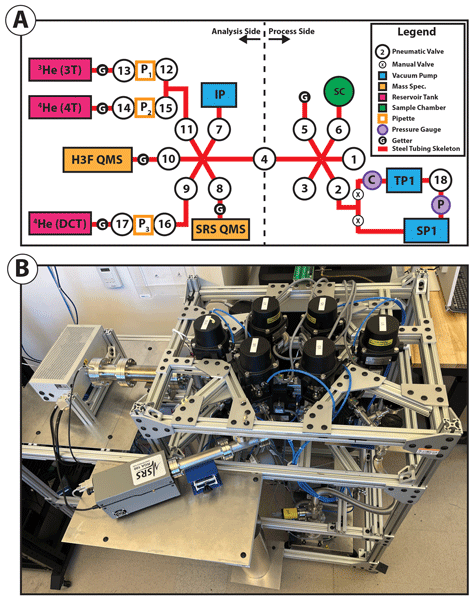
To achieve the goals of an adaptable line with minimized internal volume, we designed a unique configuration in which pneumatic valves are arranged around two hexagonal manifolds (vacuum chambers with multiple openings; Fig. 1). This design allows a large number of valves, and therefore line components, to be arranged closely together using a relatively small total length of stainless-steel tubing, therefore minimizing the total internal volume. The hexagonal manifolds also allow for easy rearrangement of hardware and have unused and available ports that don't significantly increase internal volumes but are available for more components (e.g., diode laser, vacuum pumps, additional getters) to be added in the future.
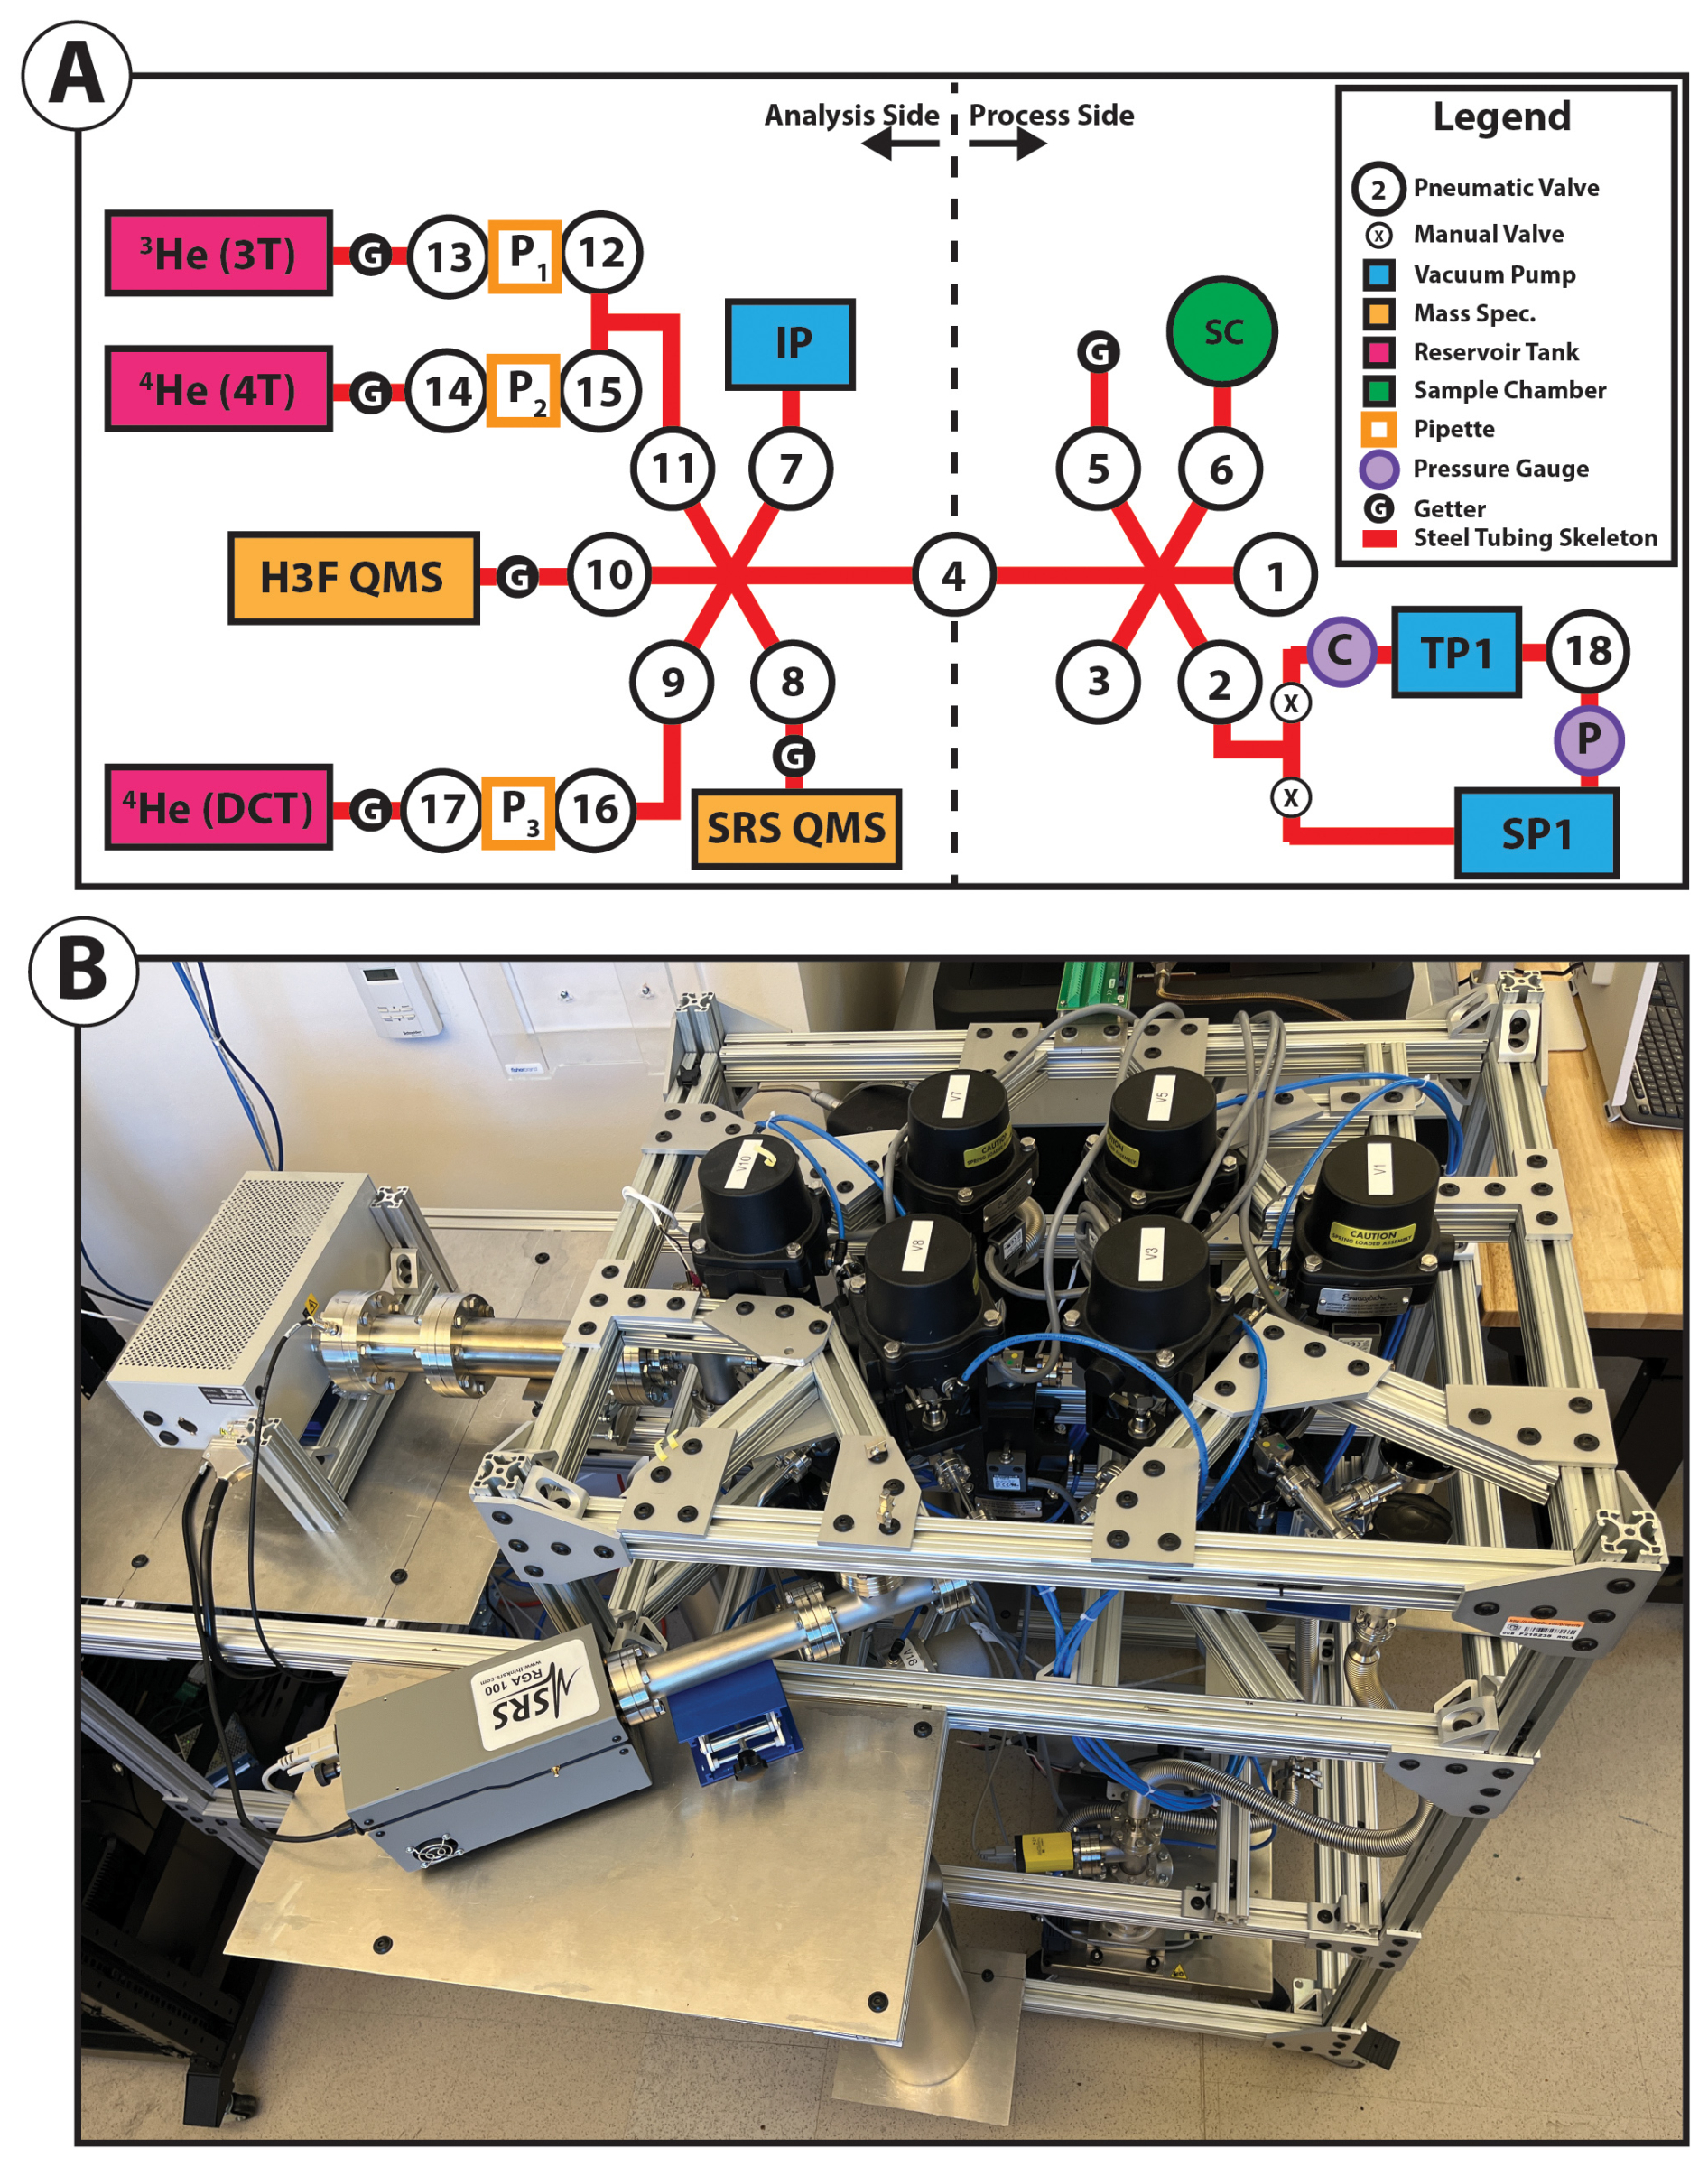
Figure 1(A) Schematic diagram of the Jimbochron highlighting key components and connections. The line is conceptually divided into a “Process Side” which is exposed to relatively high pressures of atmospheric gas during sample exchange, and the “Analysis Side” which only regularly sees gas that has been gettered and cleaned. The three vacuum pumps (in blue) are the Ion Pump (IP), Turbo Pump (TP), and Scroll Pump (SP). The three reservoir tanks (in pink) are the 3T tank that contains 3He, and the 4T tank and DCT (depletion-correction tank) that contain 4He. The tanks each have a getter and are attached to three separate pipettes labeled P1, P2, and P3. The two quadrupole mass spectrometers (QMS, solid orange boxes) are the Hiden 3F® (labelled H3F) and the Stanford Research Systems RGA100® (labelled SRS). The purple circles are the Pirani (P) and Cold Cathode (C) pressure gauges. (B) Picture of the Jimbochron in a similar orientation to the schematic diagram in (A). Note many of the valves are mounted with the actuators facing down and not visible in the picture.
We also prioritized selecting a mass spectrometer with high sensitivity. He measurements on the Jimbochron are performed by quadrupole mass spectrometry because many commercially available quadrupole mass spectrometers (QMSs) are easy to install, simple to maintain, affordable, and more than sensitive enough to accurately and reproducibly measure the gases necessary for analyses. Although magnetic sector mass spectrometers have considerably more resolving power, their cost and more difficult maintenance have made QMSs more common in labs. As explained in more detail in Sect. 3.6, the Jimbochron uses a QMS that is approximately an order of magnitude more sensitive than the QMS on our existing Alphachron® He system.
In addition, developing flexible and accessible software for instrument control and automation was a central focus during Jimbochron development. Code that can be easily modified is crucial for replacing parts on the line, for updating the operating system, and for modifying protocols as our understanding of methods evolve. In addition, full automation of He analysis routines is required for efficient and reproducible noble gas analysis. For example, creating He maps of mineral grains similar to those of Danišík et al. (2017) is time consuming, and if done at any significant scale realistically requires automation.
2.2 Achieving and maintaining ultra-high vacuum conditions
Noble gas analysis typically requires measurement of sample gas in an ultra-high vacuum (UHV; < 1 × 10⁻⁸ torr) environment to minimize contamination from atmospheric gases. Although atmospheric He is not abundant (∼ 5 ppm in dry air), the amount of He contained in only ∼ 0.01 µL of air is roughly equivalent to that contained in a typical apatite crystal. It therefore is necessary to evacuate an analysis line to as low a pressure as possible. Lines typically achieve and maintain ultra-high vacuum conditions using multiple vacuum pumps, getters, and all-metal bakeable components.
Conceptually, the Jimbochron can be divided into the process and analysis sides of the line (Fig. 1). The purpose of segregating the line in this way is to keep the line as clean and at as low a vacuum as possible. The process side is where samples are loaded and initially put under vacuum, so this side is regularly exposed to atmosphere. It is good practice to minimize the line volume exposed to atmosphere during sample loading to preclude adsorption of atmospheric gas to internal surfaces. The analysis side of the line, which includes the mass spectrometer, is only exposed to higher pressures on rare occasions when significant maintenance (e.g. changing a mass spectrometer filament) is required. Only small volumes of conditioned (see next section) sample gas are released into the analysis side of the line. The process side of the line is primarily pumped by the turbo and scroll pumps, whereas the analysis side of the line is primarily pumped by the ion pump (see Sect. 3.5). Pressures measured by the mass spectrometer in the analysis chamber of the Jimbochron are typically < 5 × 10⁻¹⁰ torr.
The attainment of ultra-high vacuum conditions is enhanced by “baking out” the system at elevated temperatures in order to release and pump away adsorbed gas. All of the tubing, flanges, and components are safe to bake out to at least 225 °C, however we found 200 °C sufficient to reduce pressures to < 1 × 10⁻⁹ torr. After construction the Jimbochron was baked out at 200 °C for ∼ 48 h using heating tapes controlled by an Amptek BT-15® benchtop temperature controller and monitored with an integrated type K thermocouple.
2.3 Gas handling: Liberating, conditioning, and analyzing the gas
He lines have three main tasks required to analyze the radiogenic He trapped in geologic materials: gas must be liberated, conditioned, and analyzed. A common way to liberate the gas trapped in a crystal is with lasers. Long-wavelength lasers heat the sample to diffuse the gas out of the crystal. Short-wavelength lasers ablate a small part of the sample to break apart the crystal lattice and release the trapped gas. Vacuum resistance furnaces, induction furnaces, or projector-bulb style diffusion cells (Farley et al., 1999) can also be used to heat the sample. However, lasers are generally preferred over these other methods because long-wavelength lasers heat smaller volumes and produce lower He blank levels during whole grain heating (e.g. House et al., 2000), and short-wavelength lasers can ablate small regions of the sample to measure gas in situ. The Jimbochron's primary approach for liberating the gas from crystals is through laser-ablation with a short-wavelength excimer laser (an ESL NWR193UC® laser), although a long-wavelength diode laser will be added in the future to enable conventional whole crystal heating and continual ramped heating techniques (Idleman et al., 2018).
After the gas has been liberated, it is expanded into the analysis line and conditioned. Although conditioning can involve a variety of processes, on the Jimbochron it means that the gas is cleaned and spiked. The Jimbochron cleans the liberated gas using multiple getters (see Sect. 3.5). Getters are devices that contain highly reactive and porous compounds, often zirconium alloys or powders, that bond with or trap non-noble gases and effectively sequester them from the rest of the line. The 4He liberated from the sample is also spiked with 3He (see Sect. 5.1). The combined gas is given time to mix and interact with the getters prior to analysis.
Finally, the 4He and 3He are analyzed using a quadrupole noble gas mass spectrometer (Sect. 3.6). The Jimbochron analyzes the gas in static mode, in which the analyzed gas is isolated from the vacuum pumps during measurement (Reynolds, 1956), allowing for repeated measurements of very small amounts of gas. After analysis, the valves to the vacuum pumps are opened and the gas is pumped away in preparation for the next sample.
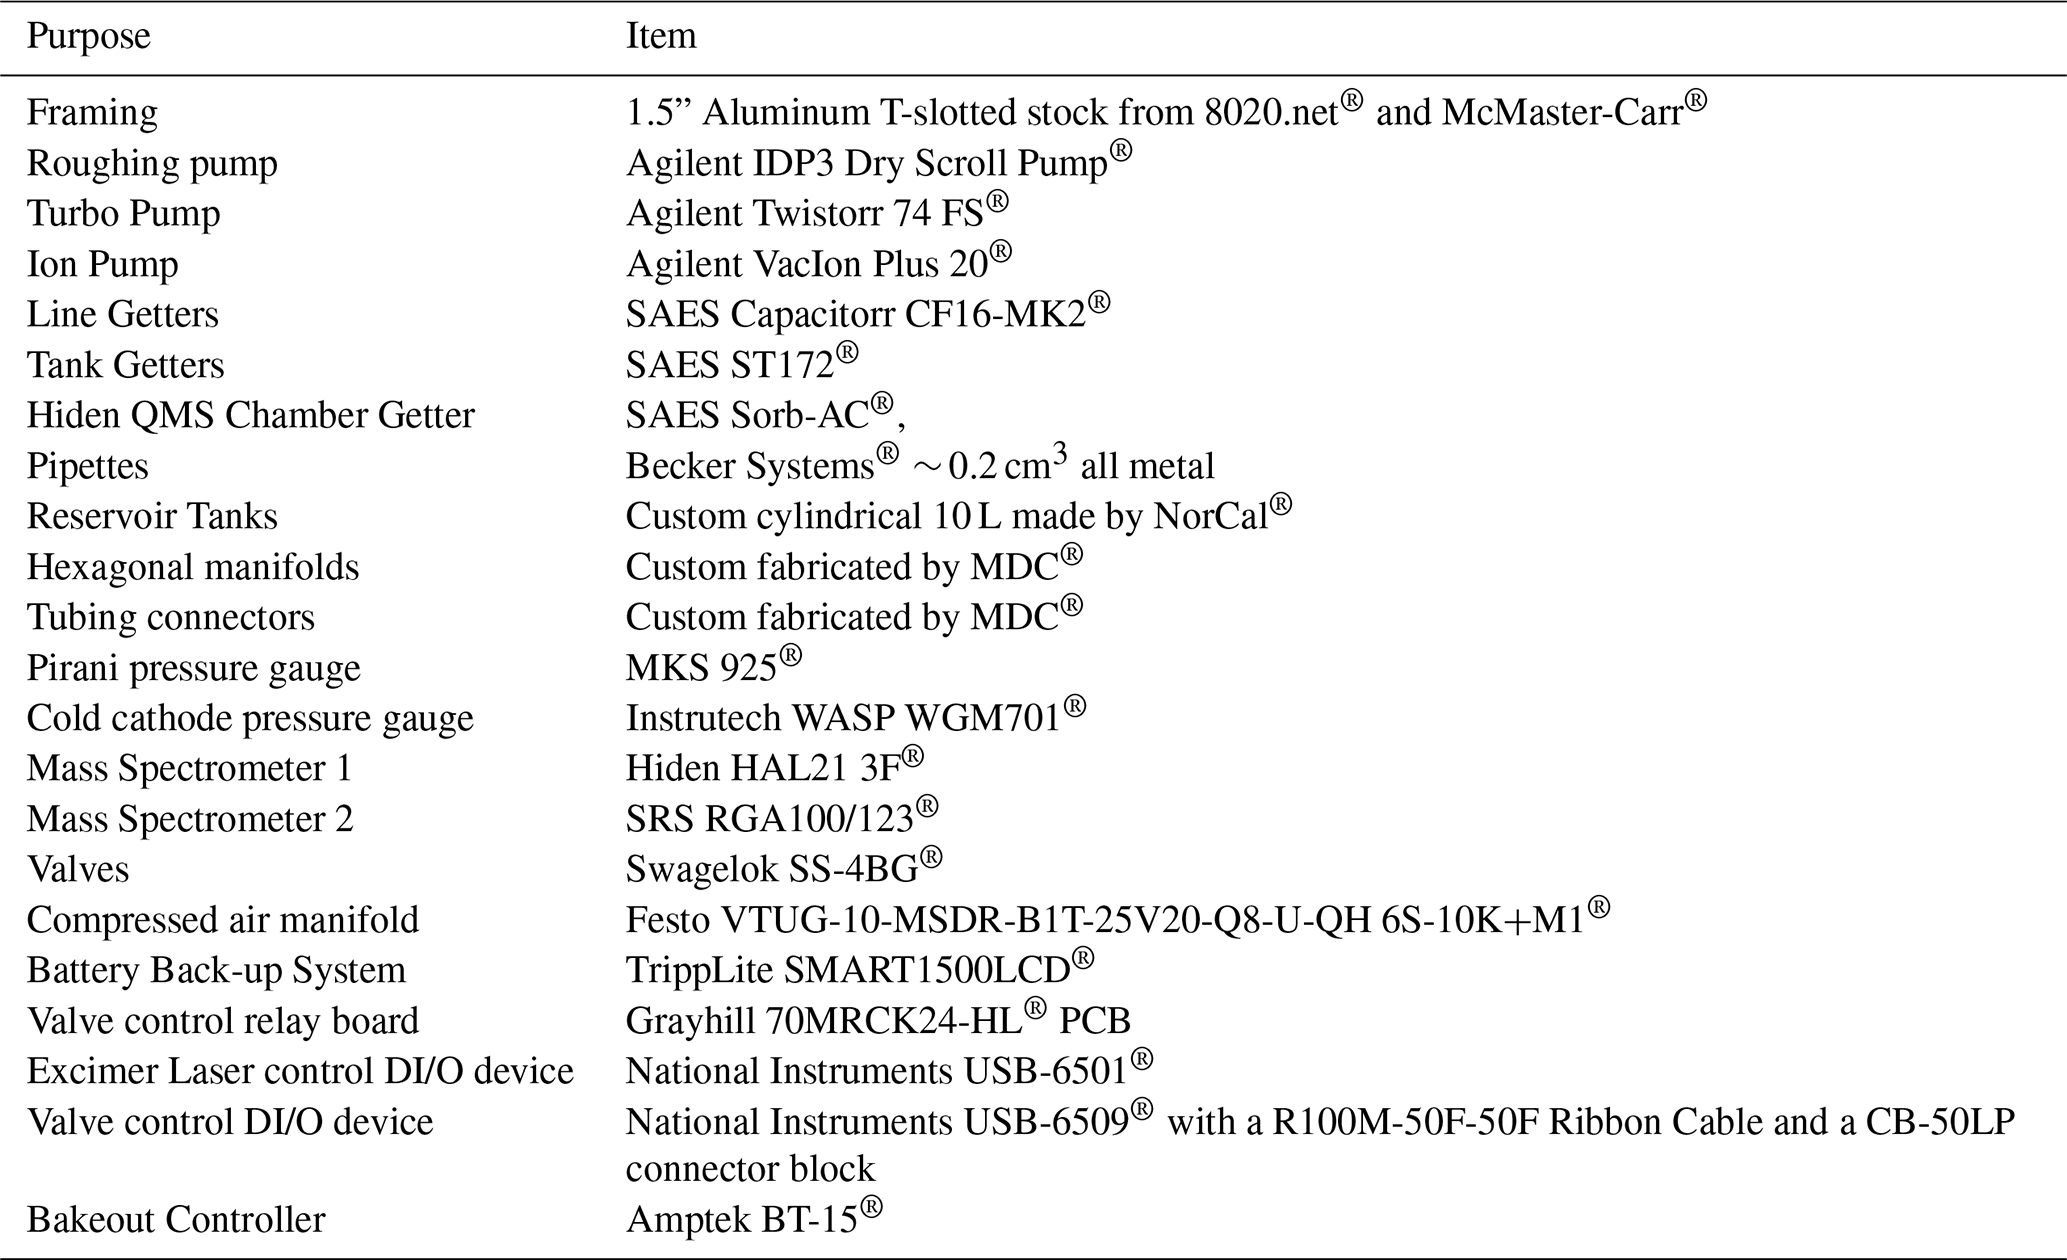
The main physical components of the Jimbochron are the framing (physical structure that holds the skeleton and components), skeleton (tubing and valves), reservoir tanks, pumps and getters, sample chamber, and quadrupole mass spectrometer. Electricity and compressed air are also required for the Jimbochron's operation. Table 1 lists the main parts and suppliers. Figure 1 illustrates their layout on the Jimbochron.
3.1 Framing
The Jimbochron is constructed on a metal frame of 1.5” wide T-slotted aluminum bars to ensure that the components and tubing of the line are arranged and supported properly. T-slotted aluminum framing systems are inexpensive and versatile, with multiple vendors such as 8020.net® and McMaster-Carr® offering a wide variety of connectors, brackets, mounts, and other accessories. The framing lengths can be cut easily using a non-ferrous metal blade on a standard miter or cutoff/chop saw, so all sizing and finishing can be done in-house, allowing for future modifications and additions. It also is straightforward to tap threaded holes into the framing, further simplifying customization. Additionally, the Swagelok® pneumatic valve bodies (see Sect. 3.2) can be attached directly to the aluminum framing using the two standard mounting holes present on the Swagelok® 5 series actuator bodies, negating the need for additional valve supports or holders.
The aluminum framing is light enough, even when holding all of the line equipment, that it can be placed on wheels and moved around easily. Mobility is an important consideration for our design to allow the line to be as close as possible to the excimer laser during use, but conveniently moved out of the way for maintenance or other laser applications. Although the rigidity of aluminum can transmit vibrations from turbo or roughing pumps, these vibrational effects can be avoided (see Sect. 3.5). While welded steel frames can offer more strength and stability, aluminum frames are lighter, more adaptable, and require little skill, equipment, or experience to assemble.
The aluminum frame was constructed so that the midpoint height of the Jimbochron matches the height of the sample chamber of our ESL NWR193UC® laser (∼ 110 cm above the ground). This design requires only a short (several cm) flex hose for the connection between the two, therefore minimizing the total line volume. Excimer lasers are relatively tall compared to other laboratory equipment, so a “standard”-height analysis line would require longer connector tubing.
3.2 Skeleton
The term “skeleton” refers to the central network of tubing and valves to which various components can be attached (Fig. 1). The main skeleton of the Jimbochron consists of 1/4” outer diameter (OD), electro-polished, stainless-steel tubing and manifolds. The components are attached to all-metal Swagelok pneumatic valves with normally closed actuators and ConFlat® or VCR® style all-metal, bakeable, ultra-high vacuum compatible seals.
ConFlat® seals use a copper gasket pressed between two stainless-steel flanges with sharp, “knife edge” ridges to form the seal. ConFlat® flanges are the preferred vacuum seals for the main line components because they are stable and sealing them does not introduce any torque into the line. Although vertical ConFlat® flanges can be challenging to seal properly because of difficulties in properly aligning the gasket, we found the method of McCabe and Utz (1999) to be highly effective.
VCR® seals use copper, nickel, or stainless-steel gaskets pressed between two highly polished and rounded surfaces. Components made with multiple VCR® flanges can be more difficult to seal than ConFlat® flanges, owing to the torque introduced while tightening the seals. Therefore VCR® seals are only used in a few instances on the Jimbochron and avoided when possible.
3.3 Reservoir tanks
Our method for calibrating the mass spectrometer requires three isotopically pure reservoir tanks (one tank with 3He and two tanks with 4He), each attached to their own ∼ 0.2 cm3 all-metal gas pipette (Sect. 5; Fig. 1). These tanks are referred to as the working 4He tank (4T), the 3He spike tank (3T), and the 4He depletion correction tank (DCT). The pipettes are made by Becker Systems® using all-metal Swagelok BG Series 3® pneumatic valves so that they can be controlled using the same pneumatic air system as the other valves on the line. The reservoir tanks are made from stainless-steel with an electropolished interior, are designed to hold ∼ 10 L, and were custom-made by NorCal Products®. Each tank has one 1.33” ConFlat® port where a stainless-steel ConFlat® tee connects the tank to its pipette and holds a small SAES ST172® donut getter. Each getter is mounted on two-pin ConFlat® feedthroughs, is run cold, and helps maintain the He purity in each tank.
3.4 Sample chamber
The sample chamber of the laser was provided by ESL® and is made of two 4.5” ConFlat® flanges. The bottom flange has a depression to hold the sample and a port that can be connected to the vacuum line. The top flange contains a deep UV sapphire glass viewport. Sapphire glass and fused silica viewports are both compatible with 193 nm excimer lasers. While sapphire viewports tend to have lower leak rates and lower He blanks than fused silica, fused silica viewports have significantly higher transmissivities. We have tested both materials and decided to use the sapphire viewport because the He blanks with the fused silica viewport were far too high. The chamber attaches to the ESL® laser sample stage which holds the sample at the appropriate focal length for the laser to focus on the sample surface.
3.5 Pumps, getters, and gauges
The UHV conditions (Ptotal < 1 × 10⁻⁸ torr) required for low blank and high-precision analyses on the Jimbochron are maintained using three vacuum pumps (Fig. 1). The line's workhorse pumps are an Agilent IDP-3® dry scroll pump backing an Agilent TwisTorr 74® turbo pump. Although other turbo pumps have higher quoted He compression ratios and pumping speeds, in our experience the actual difference in pumping efficiency between turbo pump brands isn't that significant, perhaps indicating that the line conductance is the dominant factor. Agilent pumps were chosen because of their price (CU Boulder has favorable purchase agreements with Agilent), our experience with Agilent pump reliability, and the ease with which we can communicate with the pump controllers. The standard arrangement is for the scroll pump to work as a backing pump for the turbo. However, large volumes of gas can be pumped using only the scroll pump by isolating the turbo pump to avoid damaging the turbo rotors. Both the scroll and turbo pumps create significant vibrations, and during initial development we observed that these vibrations transmit through the aluminum framing of the line. To avoid problems associated with persistent vibration, both pumps are connected to the line only through flexible stainless-steel bellows tubing and reside on a wheeled cart that is not directly attached to the main line. Although future designs will shorten the tubing connecting the pumps to the line, in practice pump down times are acceptable as is. The third pump is an Agilent VacIon 20 StarCell® ion pump, which is only used to pump volumes when the pressures are already low (Ptotal < 1 × 10⁻⁷ torr). Future expansion plans include the addition of more pumps to allow for greater flexibility in gas handling.
In addition to the vacuum pumps, the Jimbochron employs multiple getters to both reduce the total line pressure and remove non-noble gases (see also Sect. 2.3). We currently use a combination of CapaciTorr®, Sorb-AC®, and ST172 SAES® getters, run both hot and at room temperature (Fig. 1; Table 1).
The Jimbochron measures the vacuum with three different gauges (Fig. 4). Between the turbo pump and the roughing pump is a MKS 925® Pirani gauge capable of measuring pressures from atmospheric to ∼ 1 × 10⁻⁵ torr. The Pirani gauge is mainly used during the initial evacuation of the line to know when it is safe to engage the turbo pump. Between the turbo pump and Valve 2 is an Instrutech Wasp® wide-range combination cold cathode and pirani gauge that can measure pressures from atmospheric pressure to 7.6 × 10⁻¹⁰ torr. This gauge is used to monitor the vacuum in the process side of the line. The ion pump measures pressure on the analysis side of the line but is only used when pressures are below ∼ 1.0 × 10⁻⁷ torr. The QMS can also be used to measure the pressure of the analysis chamber, and in practice gives readings that are similar to the ion pump.
3.6 Quadrupole mass spectrometers
The Jimbochron has two QMSs. The main QMS is a Hiden 3F® equipped with both a faraday cup and a single channel electron multiplier, customized to only analyze a 20 amu range in order to maximize the resolution of the He peaks. We chose the Hiden 3F® primarily because the manufacturer-provided data indicate that it is both approximately an order of magnitude more sensitive than other QMSs commonly used in labs and its triple-quadrupole filters separate mass peaks more effectively than single-quadrupole filter machines. Additionally, Hiden® provides extensive and free LabView® drivers for their mass spectrometers which makes automation straightforward (see Sect. 5).
The Jimbochron also has a Stanford Research Systems (SRS) RGA100 QMS® (RGA-residual gas analyzer). This QMS is less expensive and less sensitive than the Hiden®, but has a larger mass range. It will be used for future continual ramped-heating (CRH) experiments, which require a mass spectrometer to be exposed directly to the sample chamber during heating and degassing (Idleman et al., 2018). The CRH method can result in large gas volumes being introduced into the mass spectrometer chamber, and we decided it would be beneficial to allow the laser-ablation side of the line (the Hiden®) to remain as clean as possible during experimentation and development. The CRH method is beyond the focus of this contribution, so this second QMS will not be discussed further.
3.7 Electricity and compressed air
Operation of the analysis line requires both electricity to operate various components and compressed air to open and close the pneumatic valves. Historically, the lab has suffered outages and interruptions of both power and compressed air, so the Jimbochron design includes backup systems for both.
The electrical components are backed up by a single, rack-mounted, 120 V uninterruptible power supply (UPS). During operation, the entire line only requires ∼ 250 W of power, so even an inexpensive UPS backup system can provide > 20 min of run time. In practice this system has worked successfully during all but the longest (> 5 min) power outages that the line has experienced in the last few years. An integrated lab-wide UPS system would be ideal, but the cost of installation and maintenance, coupled with the rarity of long-duration power outages, has led us to not prioritize adding a lab-wide system.
The compressed air system which supplies air to the Festo valve manifold is backed up by a reservoir tank that can be filled by either the building compressed air (primary source), or a pressure-activated, external, oil-free air compressor that is also on a UPS system (Fig. 2). The compressed air backup system is important not only for outages but also for low-pressure events caused by leaks, broken equipment, and building events that affect the compressed air supply. Although Swagelok® claims that the pneumatic valve actuators will work with pressures as low as 50 psi, in our experience the response is uneven below about 90 psi with some valves opening and others not.
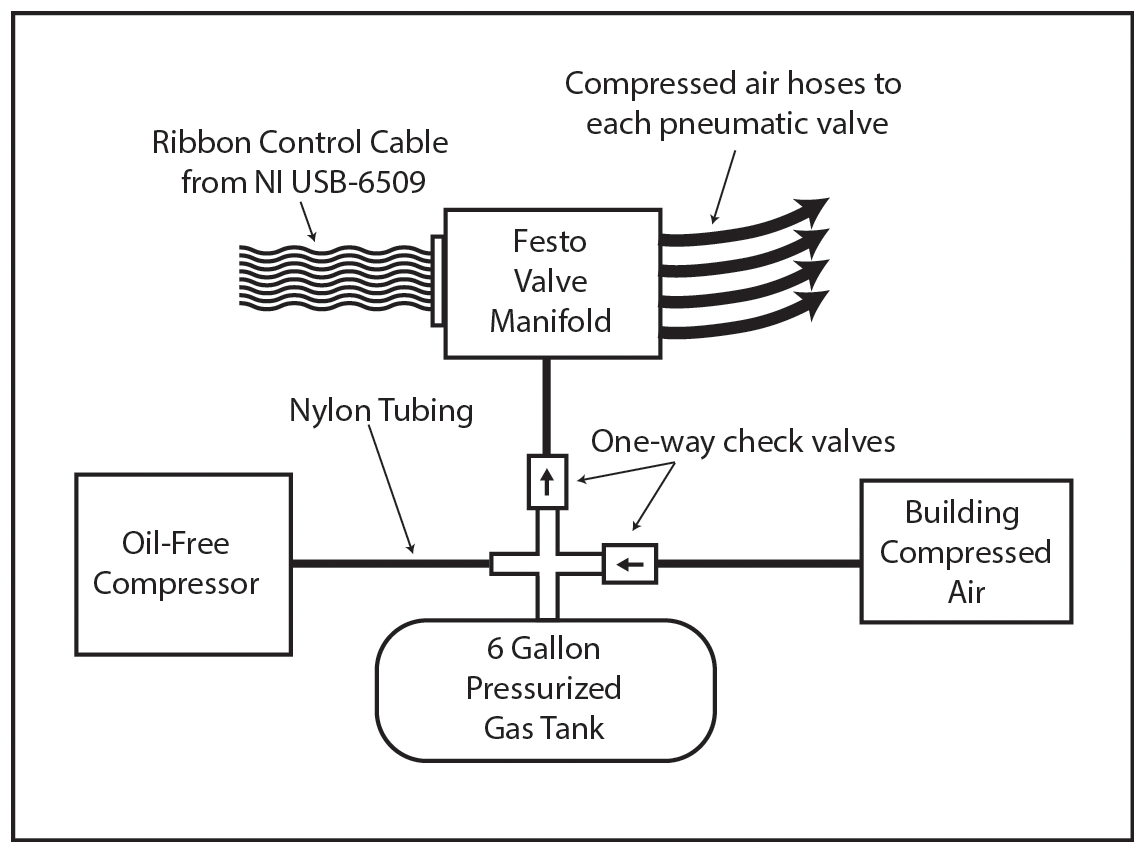
Figure 2Schematic diagram of the compressed air backup system. A 6-gallon stainless-steel tank is connected through a tee-connector to a pressure-activated oil-free compressor, the building compressed air supply, and the Festo® valve manifold. One-way check valves ensure that if building air pressure is lost, the tank and compressor volumes will maintain their air pressure (direction of allowed flow shown by the arrows).
Importantly, the Jimbochron is designed to fail safely during an extended power outage. The default configuration is for all of the valves to be closed. When power is lost, the valve manifold will depressurize even if the air pressure is sufficient for operation. The scroll pump also has an isolation valve on the inlet that automatically closes when power is lost, preventing air from rushing into the turbo pump. In practice when the Jimbochron loses power the interior of the line, including both the sample chamber and mass spectrometer, do not experience sudden increases in pressure.
4.1 Communication
Efficient and reproducible noble gas analysis requires that all of the critical components are automated, which involves important hardware and software components. Most modern lab equipment has communication and control capabilities included as standard features, typically connecting to a PC via serial communication protocols.
The PC used to control the hardware has a limited number of serial ports and is far enough from the electronics rack holding the Jimbochron controllers that hubs and converters are leveraged to reduce the number of cables crossing the lab. USB cables from the PC lead to two separate hubs, a USB to DB9 serial hub with 8 ports, and a powered USB 3.0 hub with 6 ports. Figure 3 is a schematic illustration of the connections and devices used for communication. Many of the devices, including both mass spectrometers, ion and turbo pump controllers, cold cathode gauge, and capacitance manometer, are connected directly to these hubs.
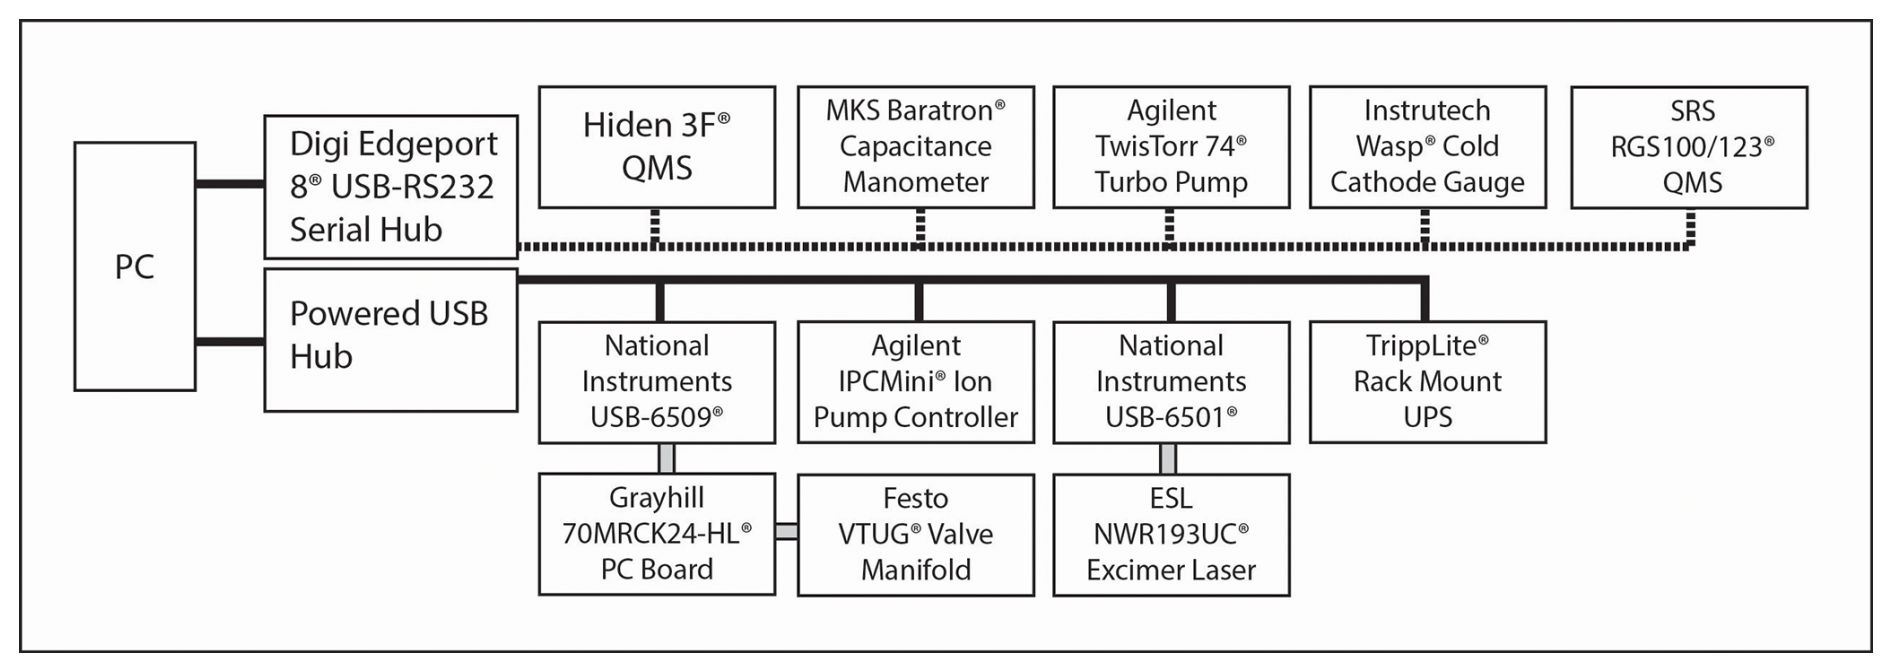
Figure 3Schematic diagram of the communication connections used to control the Jimbochron. The solid black lines are USB cables, the dashed lines are RS232 DB9 serial cables, and the thicker grey lines are miscellaneous cables (ribbon or BNC).
Two devices require additional communications hardware. First, the valve controls are routed through a USB to ribbon cable converter (National Instruments USB-6509®), which operates relays on a PC board. This board in turn powers solenoid valves in a Festo® pneumatic valve manifold that regulates compressed air delivery to the valves. The electrical connections on the PC board are also connected to manual 3-way switches so that each pneumatic valve can either be controlled remotely via the PC, or manually using switches mounted on the front panel of an electronics rack. Second, excimer laser automation is accomplished with a 24-channel USB digital I/O device (National Instruments USB-6501®) connected to an external triggering port on the laser, which is a standard feature on ESL NWR193UC® excimer lasers.
4.2 Automation
Control and automation of the Jimbochron is done with custom software written in the National Instruments LabView® programming environment. Below, we explain the choice of Labview® and the key features of the software. However, in lieu of in-depth descriptions of the software architecture, access to the key components is provided through an online repository (Metcalf, 2026).
LabView® was chosen because of our in-house expertise with the platform, and because LabView® makes it straightforward to automate and control multiple pieces of equipment, perform simultaneous tasks, record data, and develop intuitive graphical user interfaces and controls. Many manufacturers provide LabView® drivers for their devices. LabView® also features tools to facilitate direct communication with devices that lack such drivers. Additionally, National Instruments®, the company that makes LabView®, sells a variety of easy-to-use hardware items for digital and analog I/O with almost any device, and LabView is compatible with many third-party digital and analog I/O products. Moreover, the University of Colorado provides discounted site licenses for LabView®, which makes this programming environment affordable. National Instruments also provides a fully functional version of LabView® called the “LabView Community Edition®”, which is free for non-commercial users and available for multiple operating systems.
We prioritized developing four key software features based on our collective experience with analytical equipment. First, the code is editable and flexible. All key activities are written as their own subroutines, which allows equipment and software to be changed, repaired, replaced, or updated smoothly and quickly without modifying the entire project. It also allows new routines to be developed and tested offline and then added to the main code once complete. In contrast, code that locks the user into specific pieces of hardware will become outdated quickly, undermining both the longevity and efficiency of equipment.
Second, the software evaluates the line status before proceeding with a measurement routine. Although rare, lines that do not perform these checks can experience sample and data loss. Before ablating a sample, for example, the software will confirm that the mass spectrometer is still functioning (e.g. the filament hasn't died or communication hasn't been lost), that pressures are below a certain threshold, and that 4He and 3He readings are at the appropriate “blank” levels. This information allows the software to adjust in real time to changing measurement conditions, and ensures consistent analytical conditions for each sample. Additional safety checks or measurements can easily be added in the future.
Third, every action taken either manually or during automation is logged and time-stamped. This feature was originally installed for debugging purposes, but has proven to be a useful record for quality control and diagnosing irregular behavior.
Finally, all inputs, including individual analytical routines and sequences of multiple analyses, can be input as text files. This both creates a permanent record of all analyses and allows very large sequences (> 100) of analyses to be loaded easily, which is important for tasks such as automated He mapping. This strategy also facilitates consistent analytical routines and sample sequences by enabling text files to be duplicated and updated for the next analytical run, removing the human error that can be introduced when re-entering complex analytical and sample sequences.
5.1 Absolute He amounts, volumes, and depletion corrections
chronology requires determining the absolute amount of 4He in a sample. Mass spectrometers, however, only measure the magnitude of the beam of ionized particles collected on a detector (often in amps or volts depending on the detectors and amplifiers used). While the magnitude of this beam is proportional to the abundance of a particular mass, converting a measured beam into moles or some absolute amount of He requires calibration. The Jimbochron uses a variation of the isotope dilution method, described below, to convert the mass spectrometer signals into absolute amounts of 4He.
Since the 1950's isotope dilution has been the preferred method for precise and accurate isotopic measurement of elements that have more than one isotope (e.g. Stracke et al., 2014). In isotope dilution, the sample is mixed with a known amount of another solution, called a “spike”, which has a known concentration and is enriched in one or more of the isotopes of the element of interest in the sample. All of the isotopes of interest in the combined sample and spike mixture are then measured on a mass spectrometer. These data allow the amounts of isotopes in the unknown sample to be calculated (Webster, 1959).
In many ways, 4He is an ideal candidate for isotope-dilution analysis because natural samples contain essentially no 3He and isotopically pure 3He is available from multiple suppliers such as Sigma-Aldrich® and AirLiquide®. In geochronology it is common for spikes to be liquid solutions where the precise amount of spike added to a sample can be determined by weighing each aliquot (e.g. Stracke et al., 2014). Gas spikes, however, cannot be easily weighed. Instead, the absolute amount of gas in a spike aliquot is calculated using the ideal gas law, the pressure and temperature of the gas, and volume of the pipette. While pressure and temperature can be measured directly, precise and accurate volume measurements are more complicated.
For gas analysis, the spike is delivered to the sample gas as an aliquot, or shot, of gas from a pipette attached to a reservoir tank. With each shot the pressure in the reservoir tank decreases, which means that the concentration of 3He in each successive shot also decreases. This phenomenon is called “tank depletion” and can be corrected for as described below. Although this correction is small, any inaccuracy in the tank depletion rate accumulates over time. For example, in a typical year, a He line may make 5000 measurements of blanks and samples, each of which is spiked with a shot of 3He. If the reservoir tank and its pipette have volumes of 10 L and 0.2 cm3, respectively, these values yield a depletion rate of 0.99998, such that the 5000th shot would have ∼ 10 % less 3He than the first shot. Thus, even a small inaccuracy in the amount of 3He in the spike shot could become significant. Owing to regular use of the 3T tank (every analysis is spiked), this tank must be refilled and recalibrated when the 3He signal in the spike shot becomes too small for precise measurement.
There are two main ways to determine the tank depletion rate: it can be calculated or it can be measured directly. Calculating the tank depletion rate requires knowledge of only the volume of the pipette and the tank.
Where D is the calculated depletion rate, Vr is the volume of the reservoir tank, and Vp is the volume of the pipette. Measuring the tank depletion rate requires an additional tank and pipette of 4He, called the depletion correction tank (DCT), to regularly evaluate and refine the actual depletion rate of the 3He tank (3T) and the 4He tank (4T) and minimize compounding uncertainties. Directly measuring tank depletion is done by comparing the 4He/3He of standards (using a shot of 4He from the 4T and a shot of 3He from the 3T) to 4He/3He of depletion correction measurements (using a shot of 4He from the DCT and a shot of 3He from the 3T) over time. Measuring the tank depletion correction directly on a regular basis is important because these measurements reduce the uncertainty in the depletion rate as the tank is used. Otherwise, this uncertainty would compound exponentially with tank use.
5.2 Standard-shot calibration method to determine the absolute amount of 4He in a sample
The isotope-dilution variation used by the Jimbochron is the standard-shot method. This approach measures shots of a known amount of 4He (from the 4T tank) spiked with 3He (from the 3T tank) as standards, typically before, during, and after a batch of unknown analyses. This method assumes that the concentration in each 3He shot is constant between these standard measurements, which is justifiable because the tank depletion over the course of a batch of measurements is much less than the sensitivity of the mass spectrometer (∼ 0.04 % for 20 shots). The ratio of the known amount of 4He from the standards and the unknown amount of 4He from the samples to the “constant” 3He amounts can then be used to calculate the unknown 4He amounts. This method has several advantages: the 4He standard shots are used much less often than the 3He spike shots, so compounding uncertainties from errors in the depletion correction take longer to gain significance, and the absolute amount of 3He becomes irrelevant such that refilling the 3T tank requires no additional calibration.
The standard-shot calibration method requires precise knowledge of only the amount of 4He in the initial “calibration” shot from the 4T and the depletion rate of the 4T. The amount of 4He in the calibration shot can be calculated directly from the tank and pipette volumes and the pressure the tank was filled with, or can be determined using an external standard.
The volumes of all three tanks and pipettes (∼ 10 L and ∼ 0.2 cm3, respectively) were chosen to minimize the tank depletion rate and therefore minimize compounding uncertainty in absolute 4He determination. The pipette volume was also selected so that a shot of gas at the pressures the tanks could be reliably filled with would approximate the amount of 4He in typical samples. To deliver the desired He amount, significantly larger pipettes would have required lower fill pressures in each tank than could be reliably measured with our capacitance manometer. Significantly smaller volume pipettes can be problematic to fabricate because the flexibility of the metal and the valve seat can become a significant proportion of the pipette volume, which we infer could lead to inconsistent gas delivery.
As described in more detail below and shown in Fig. 4, our steps for accurately and precisely quantifying the pipette and tank volumes were: (1) metrologically determining the volumes of standard solid objects, (2) using the standard objects in expansion experiments to calibrate the volume of a vacuum chamber (thereby establishing a “known volume”), and (3) using the known volume in expansion experiments to calibrate the pipette and tank volumes. All expansion experiments were conducted using dry, ultra-high purity Ar gas. Ar was chosen because it is not affected by the getters, is easy to obtain, and any residual Ar left in the system will not impact He measurements. We checked our metrologically-determined volumes with volumes that we constrained using our existing calibrated He line. Following these volume measurements, the tanks were filled with isotopically pure 3He or 4He to the target tank pressures.
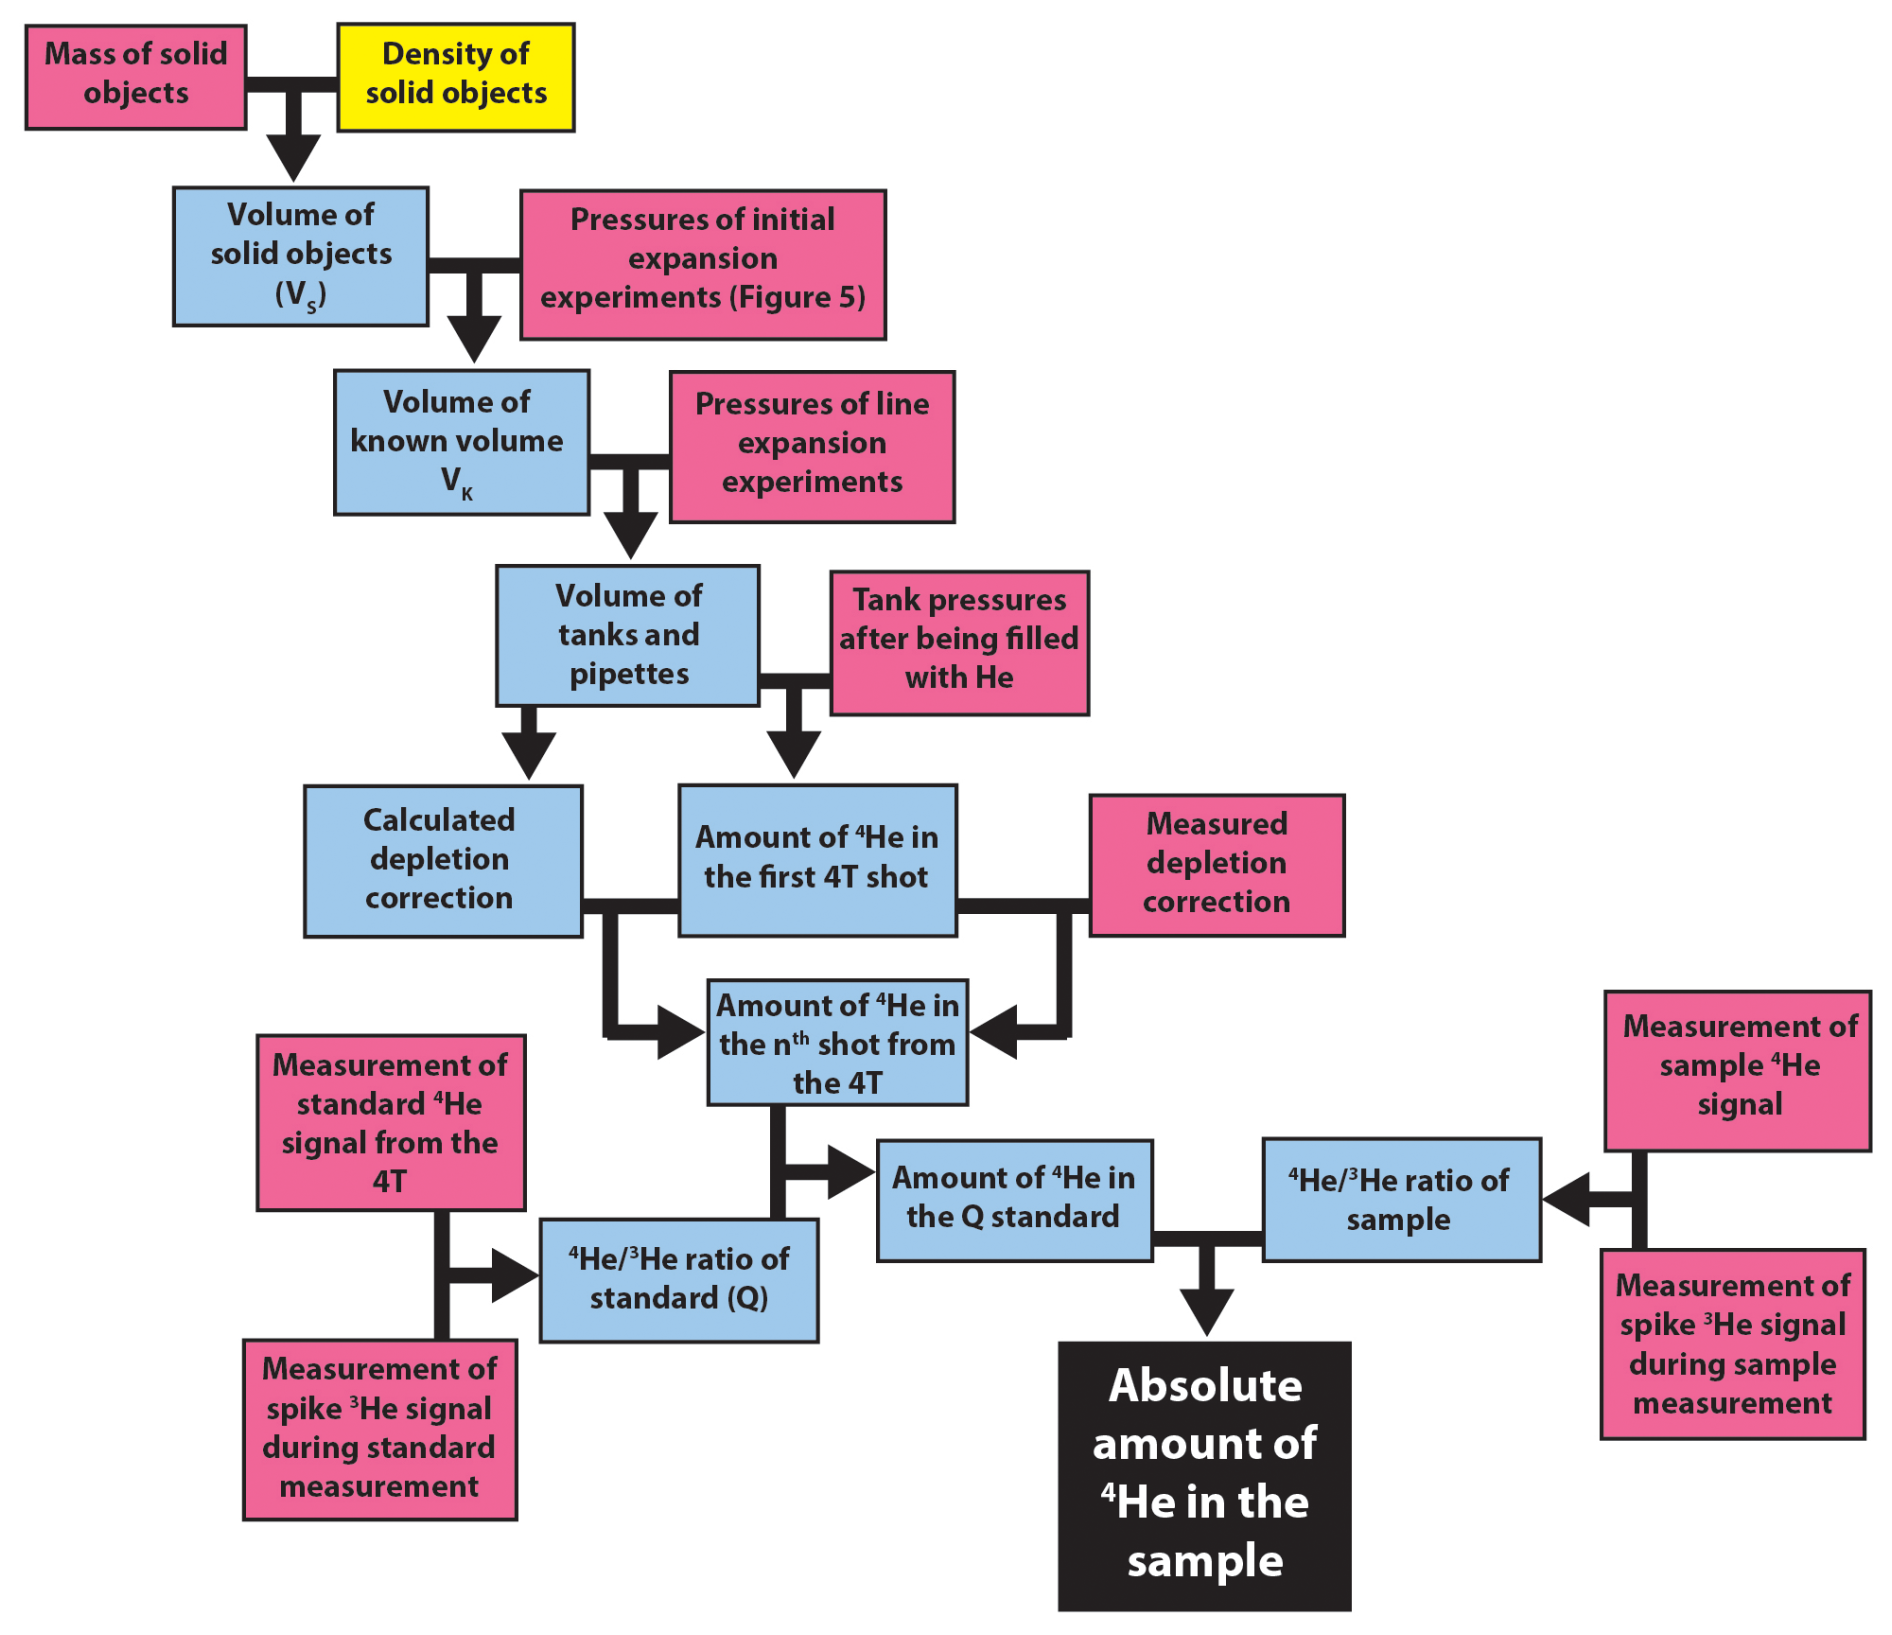
Figure 4Flow chart showing how the absolute amount and uncertainty of 4He in a sample (black box) are determined. The coloured boxes are measured values (pink), calculated values (blue), and values obtained from the literature (yellow). The black lines and arrows represent calculations where uncertainties are propagated.
An advantage of determining internal volumes and calibrating depletion corrections from first principles during the construction of a noble gas line is that uncertainties can be determined and propagated at each step. Uncertainty on the Jimbochron is accounted for in three ways. Uncertainty of the densities of the standard solid objects (Al and Si, see next section) are from the literature. Uncertainties on measured values are determined through repeated measurement (e.g. the uncertainty on the mass of the Al rods was determined by computing the standard error of 20 separate measurements). Uncertainties for calculated values, like the volume of the Al rod, are propagated from the density and mass values used as inputs. Figure 4 is a flow chart showing how the measured and calculated values combine to determine the absolute amount and uncertainty of 4He in a sample.
5.3 Determining standard volumes
Calibration of volumes in the vacuum line first requires determining the volume of one or more standard solid objects, Vs. Our standard solid objects are the right size to fit in the vacuum chamber and use readily available materials with well characterized densities so that volumes can be determined metrologically: (1) a ∼ 12 mm diameter, 99.9999 % pure rod of Aluminum that was cut into two pieces (density of 2.6984 ± 0.0003 g cm−3; Sverdlin, 2003), and (2) three 99.999 % pure ∼ 1 cm3 Silicon metal cubes (density of 2.329002 ± 0.000007 g cm−3; Henins, 1964; Table 2). While Morgan et al. (2011) used stainless-steel spheres in their calibrations, stainless-steel density can vary significantly, necessitating an independent determination of either volume or density. Volumes for the Al rods and Si metal cubes in our study were determined using the above densities and masses measured repeatedly on a calibrated balance. Each mass was weighed at least 10 times, yielding 1 s standard errors of < 0.002 %. We chose to use multiple solid objects with different densities, rather than a single object, to check the reproducibility of our volume calculations and calibration procedures.
Table 2Summary of items used for density and volume calibration.
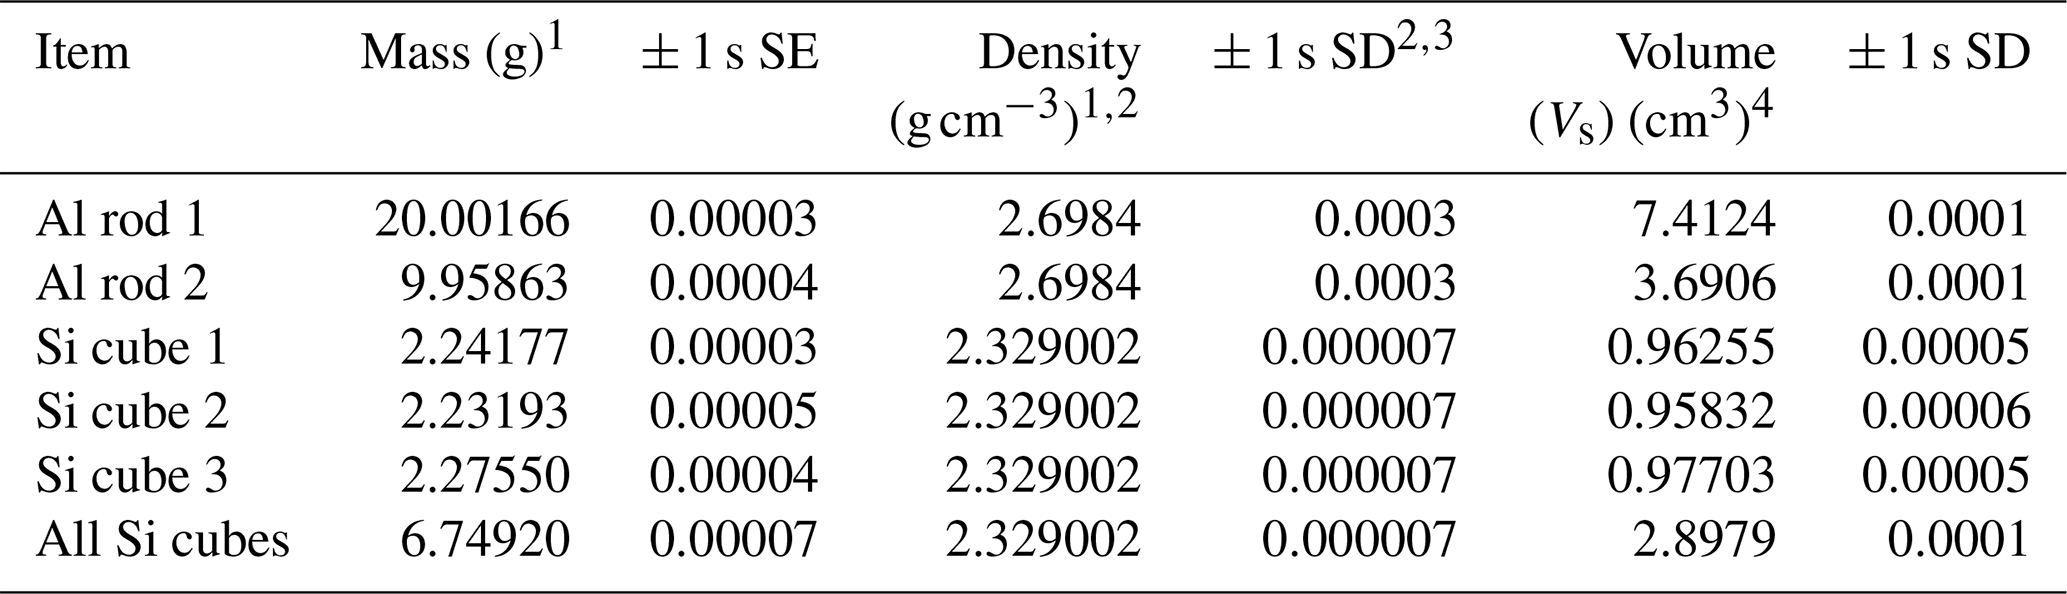
1 Each mass was weighed at least 10 times. 2 Aluminum density from Sverdlin (2003). 3 Silicon density from Henins (1964). 4 The volumes reported here are the Vs values used in the calibration procedure and associated calculations. These are shown in Fig. 5 and discussed in Sect. 5.3. Volumes were not corrected for thermal expansion because the estimated corrections based on ambient temperature were ∼ 1 × 10⁻¹⁵ cm3, much smaller than our uncertainties.
5.4 Determining a known volume
The standard solid objects were used to calibrate a known volume, VK, that could then be employed to calibrate the other volumes in the line. Theoretically we could have used any chamber of the Jimbochron for this purpose, but decided to instead create a separate, removable vacuum chamber to use as VK in case we wanted to calibrate other vacuum lines. Additionally, the sample chamber, which is the only chamber large enough on the Jimbochron to accommodate the known solid objects, had not yet been delivered at the time of calibration. The vacuum chamber used for VK is a 3” long, 1.33” ConFlat® nipple attached to a manually actuated all metal Swagelok® valve with a standard ConFlat® flange. The nipple can be opened from the end opposite the valve, which is important for this method, and resealed in a repeatable and consistent manner. We anticipate changes in the internal volume due to slight differences in the position of the ConFlat® flange when it is re-sealed between experiments to be negligible, consistent with Morgan et al. (2011).
Table 3Example Volume Calibration Measurements using the Aluminum Rod1,2.
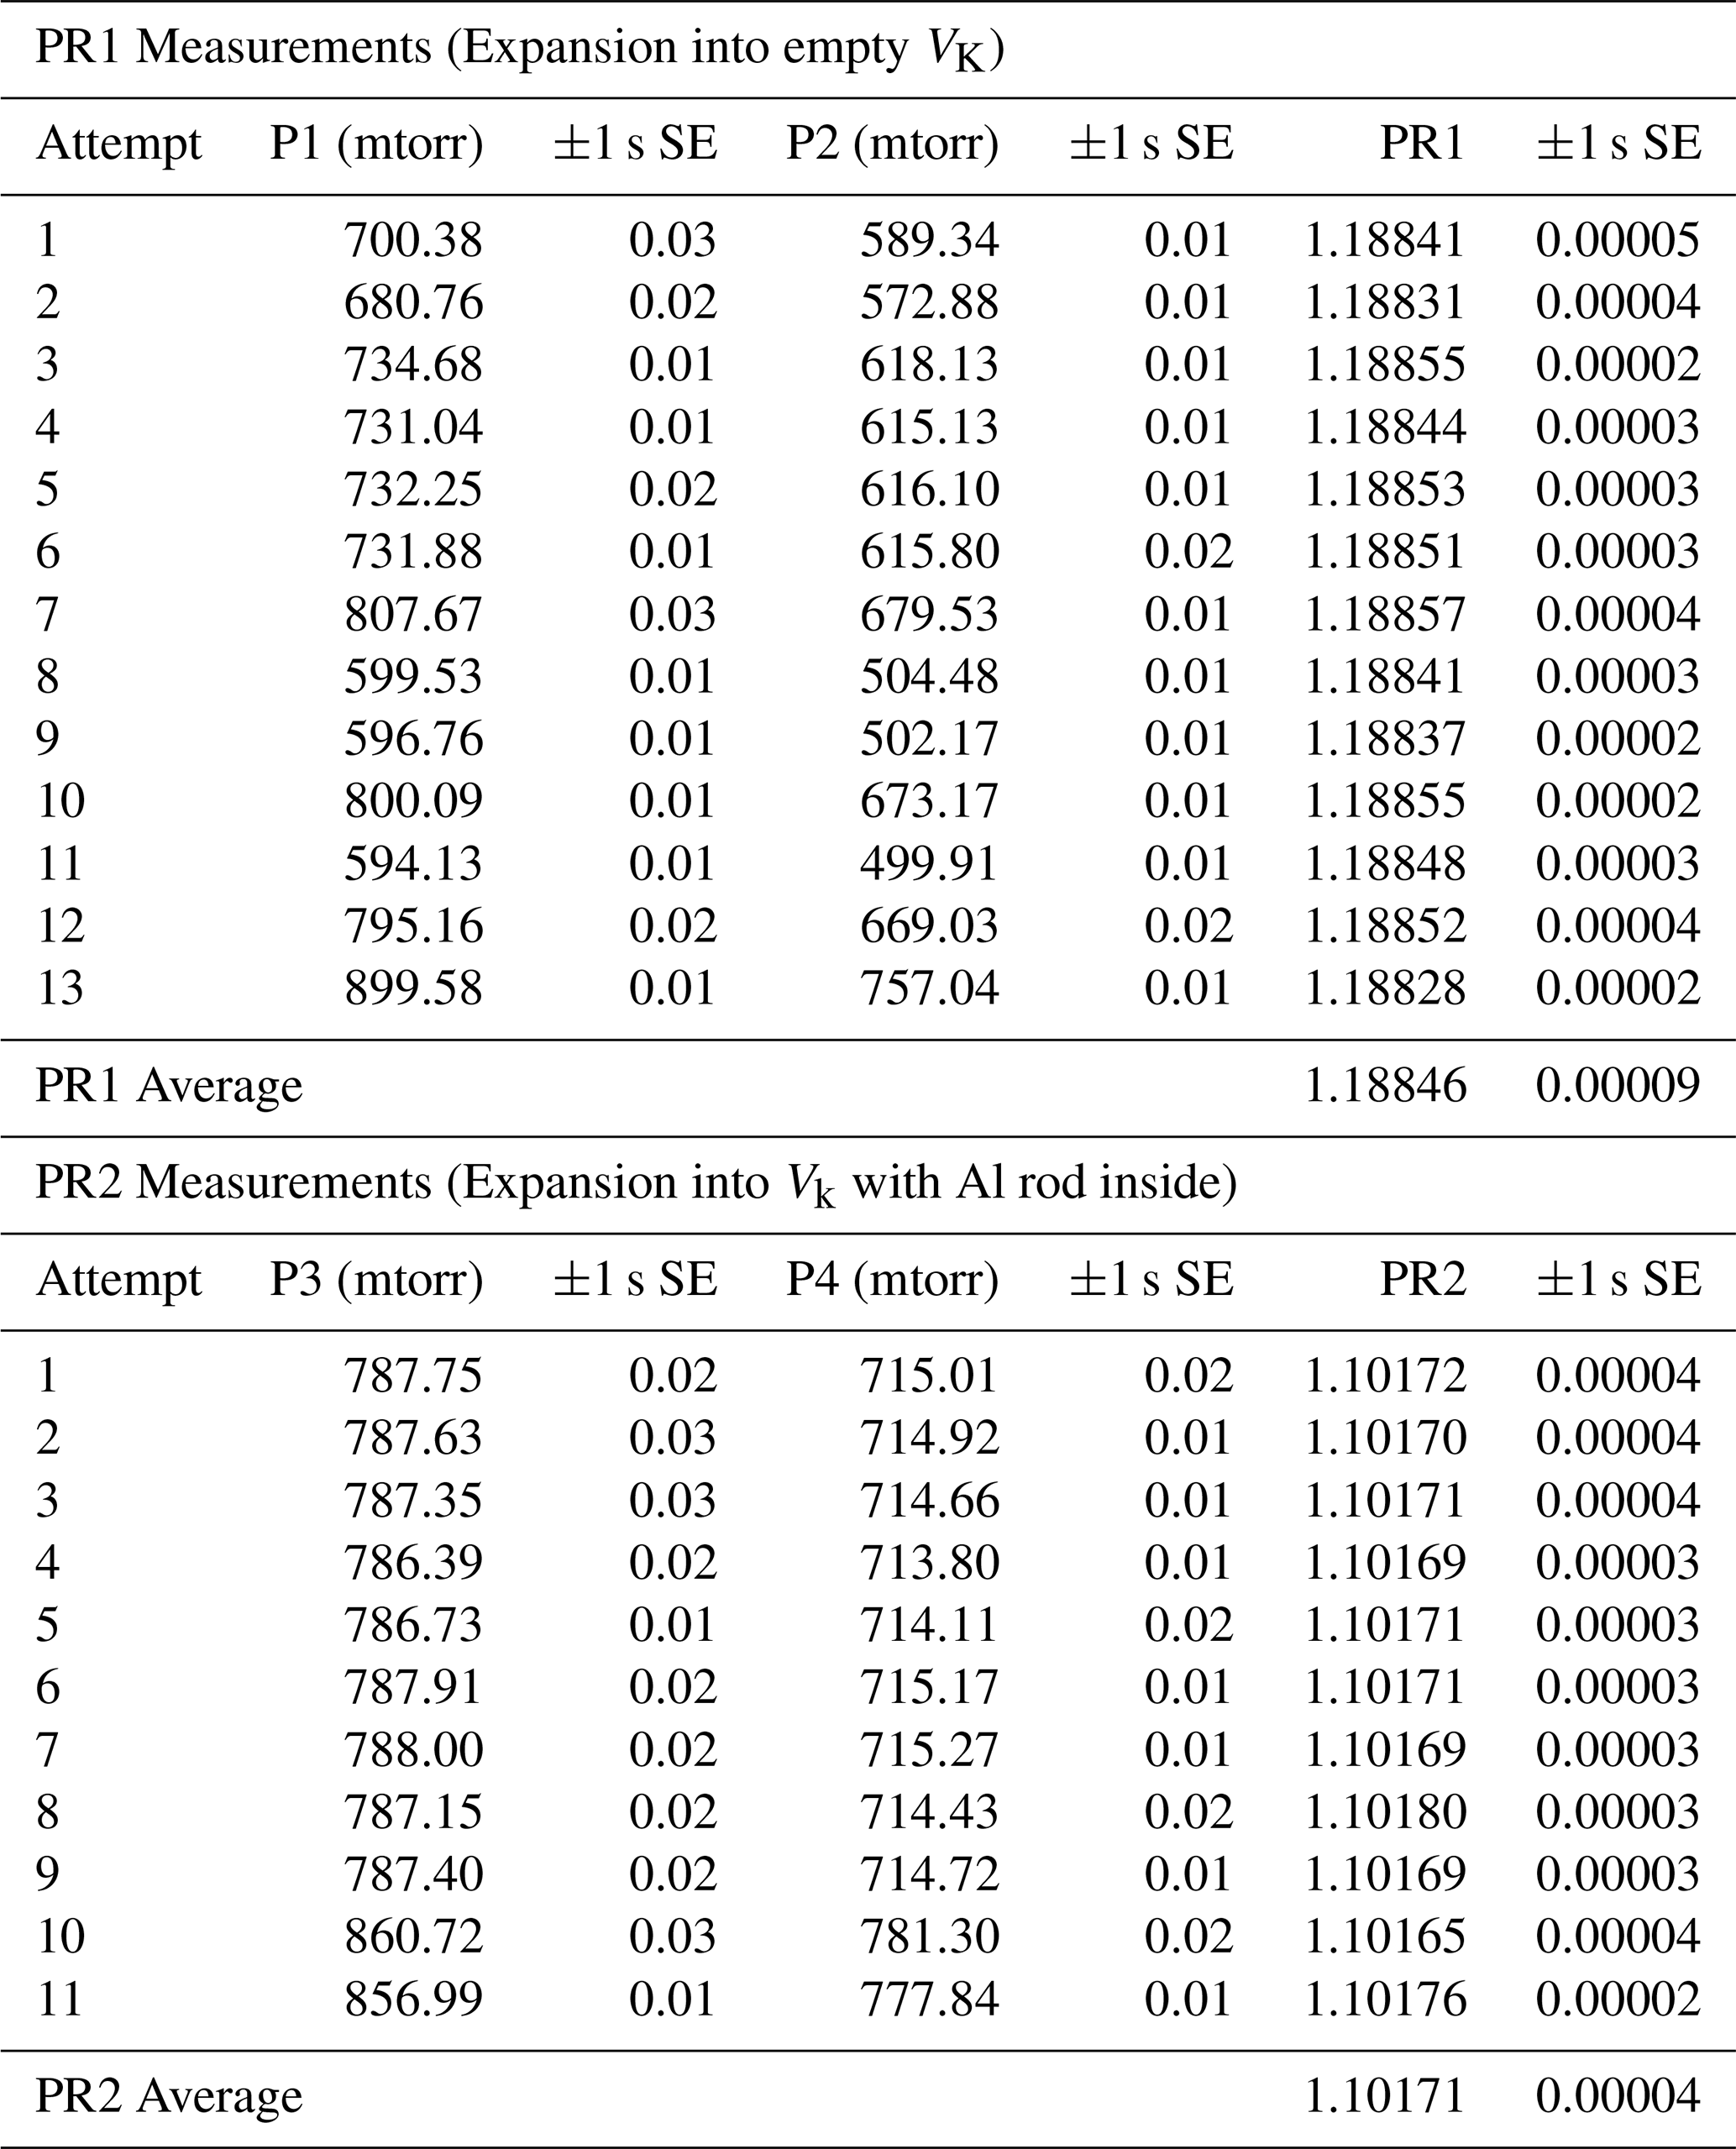
1 This experiment uses Vs = 7.4124 ± 0.0001 cm3 for the Aluminum rod (see Table 2). 2 This set of experiments yields a value for Vk = 16.104 ± 0.003 cm3. This value differs from that reported in Table 4 which is an average of multiple experiments using the different solid objects listed in Table 2.
Our method of determining VK involves measuring the pressure of a gas with an absolute capacitance manometer, expanding the gas into an evacuated VK, and measuring the resultant pressure drop (Fig. 5 steps 1 and 2). This process is repeated with a standard solid object (VS) inserted into VK (Fig. 5 steps 3 and 4; see Table 3 for an example of these pressure measurements). The difference in pressure drops between these two experiments is recorded and used to calculate VK (Fig. 5 step 5). This method is similar to that described by Morgan et al. (2011), but instead of comparing depletion curves uses expansion ratios to calculate internal volumes (Fig. 5). We recorded pressures using a 1 torr maximum range MKS 690A Baratron® absolute capacitance manometer connected to an MKS 670B® signal conditioner. Theoretically, a high-quality mass spectrometer should measure the same relative drops in partial pressure and allow for the measurement of the internal volume of noble gas lines without purchasing an expensive absolute capacitance manometer or breaking vacuum to install one.
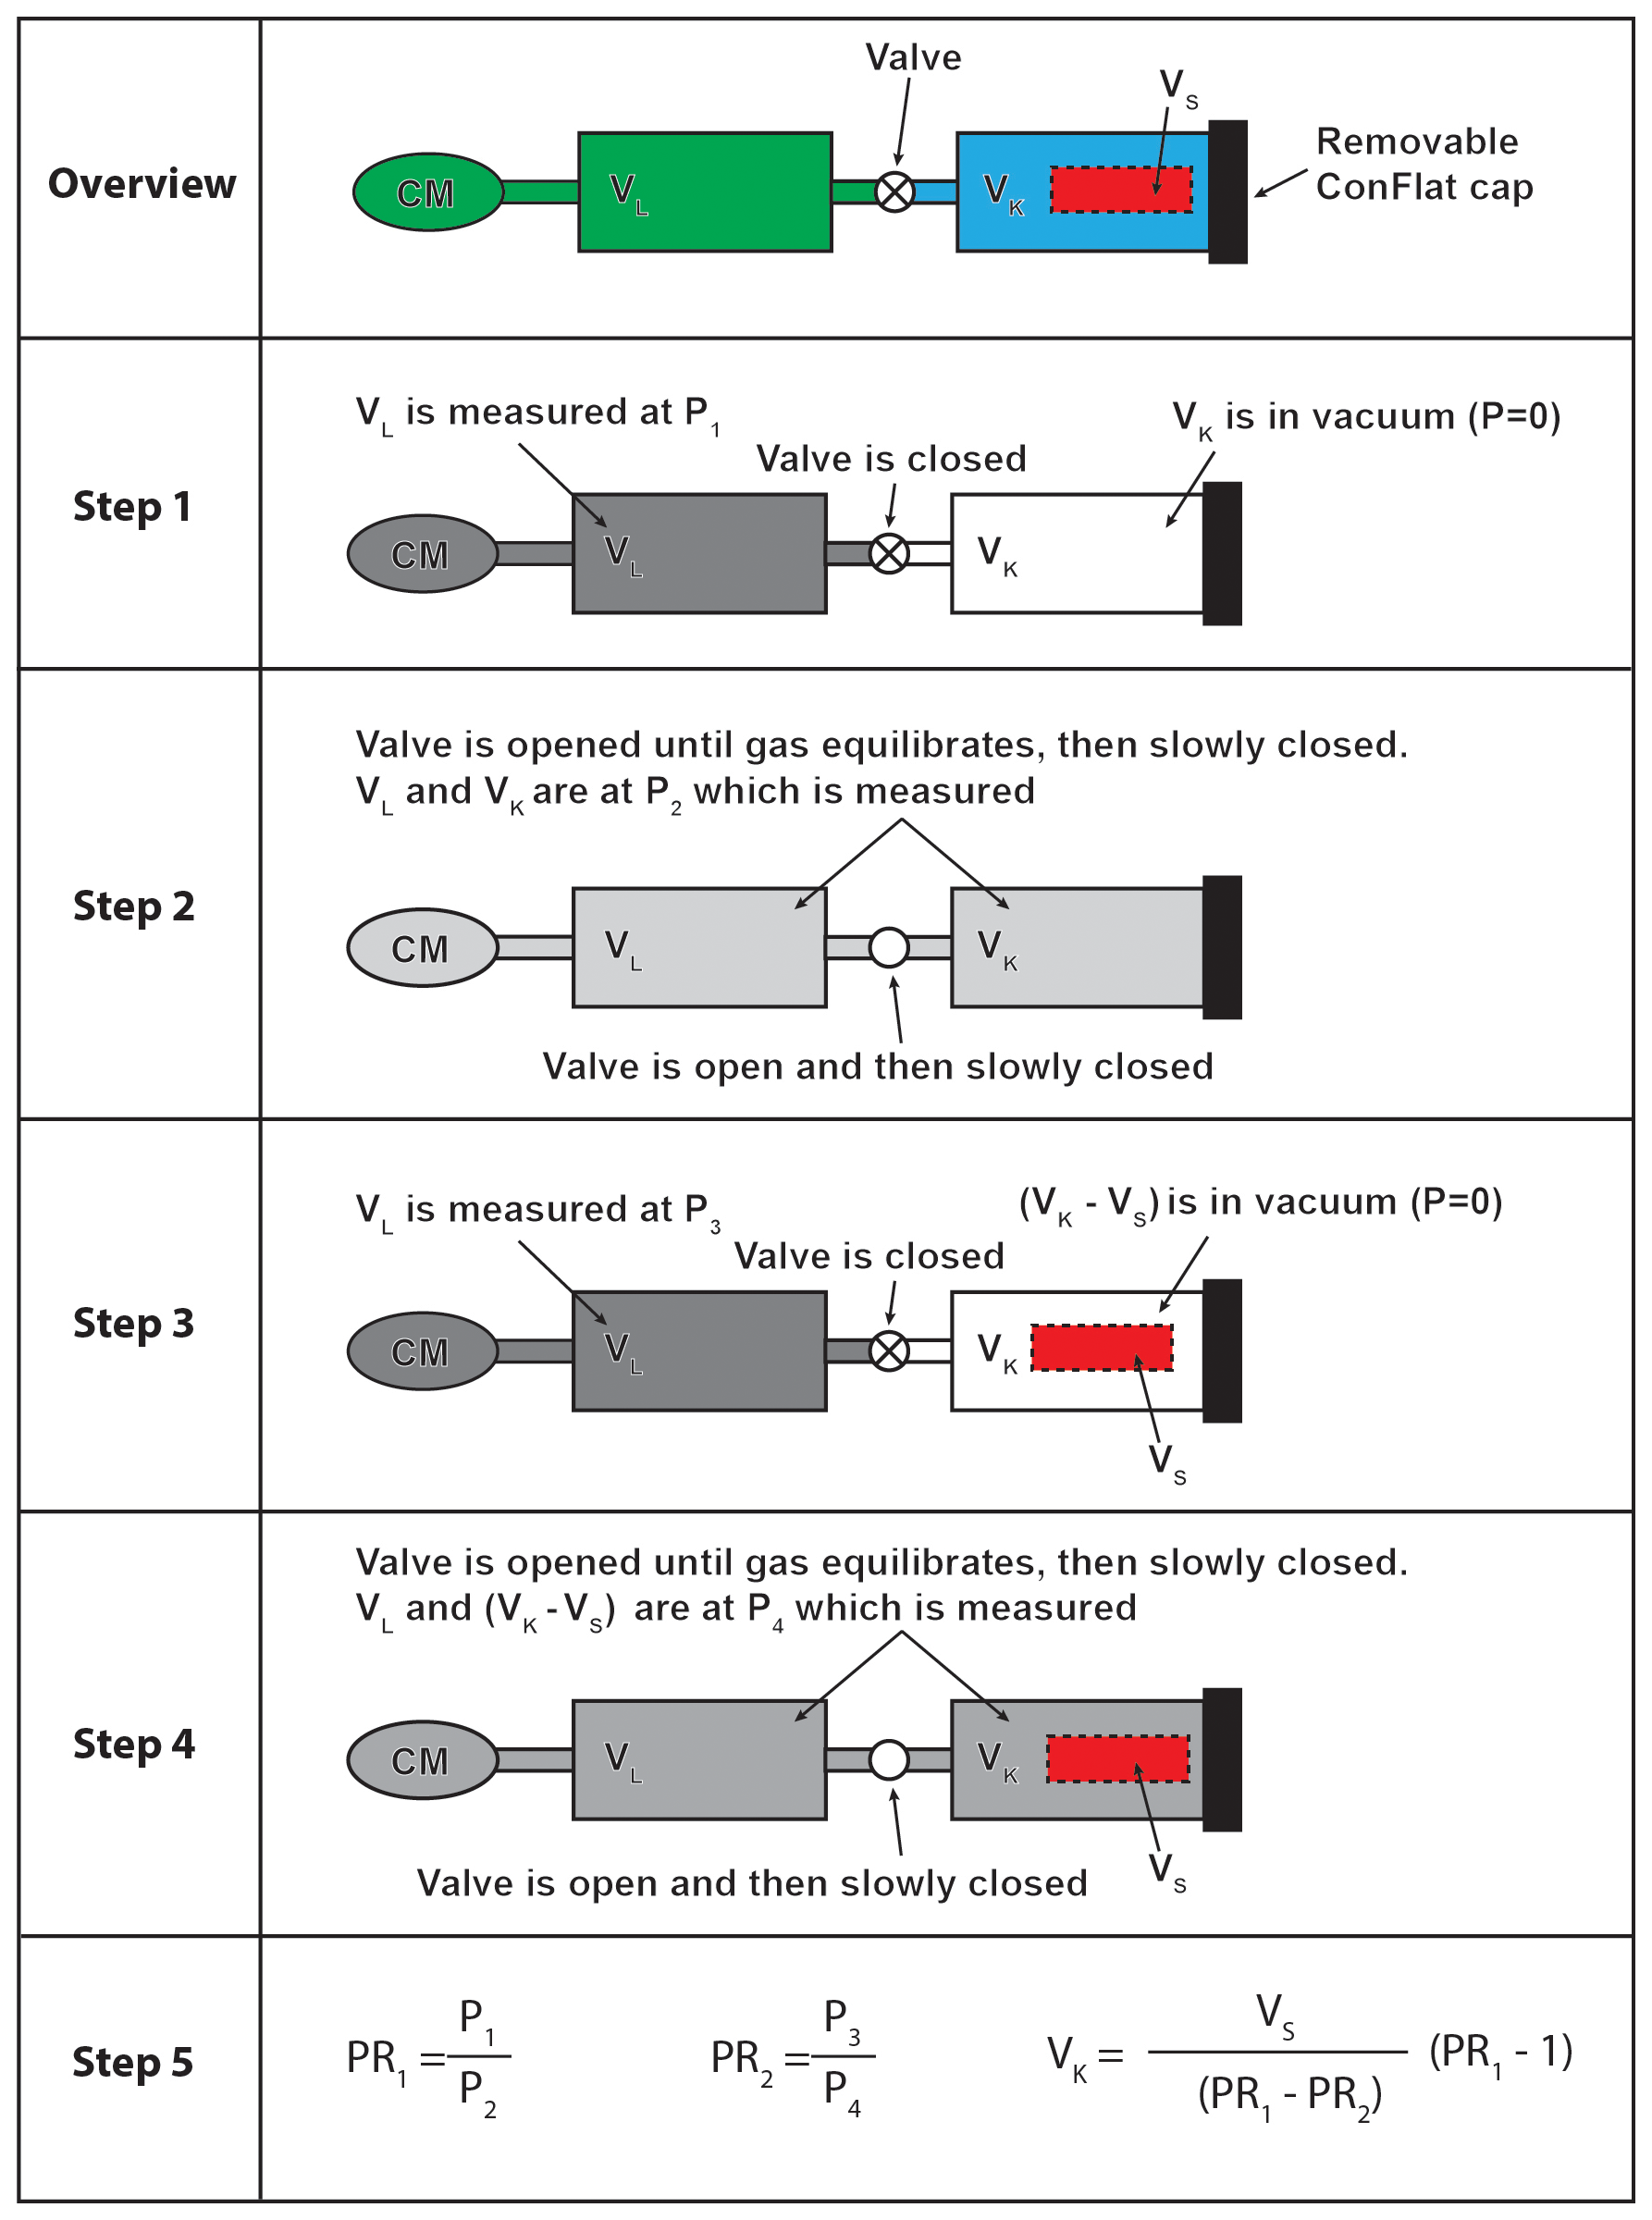
Figure 5Illustration of the process to calibrate a known volume (VK denoted in blue in the Overview) using the metrologically-determined volume of one or more standard solid objects (VS, denoted in red in the Overview). Pressures are measured with a capacitance manometer (CM), but could theoretically be measured instead with a mass spectrometer. Step 1: The pressure of a gas P1 is measured in VL (in green, the volume of the line connecting the capacitance manometer and VK). Step 2: The gas in VL is expanded into an evacuated VK, the valve is closed, and the pressure of the gas P2 in both VL and VK are measured. Steps 3 and 4: Steps 1 and 2 are repeated for measurements of P3 and P4, but with one or more standard solid objects with metrologically determined volumes inserted. Step 5 shows the equations used to calculate VK given the difference in pressure ratios (PRs) between the two expansion experiments (PR1 and PR2). When a volume is described as being “in vacuum”, it is well below the minimum pressure measurable by the capacitance manometer, which in our experiments was ∼ 1 × 10⁻⁷ torr.
The volume of VK was measured multiple times for different combinations of Si cubes and Al rods. Pressures measured every 0.5 s were recorded using custom LabView software for processing. The pressure measurements and corresponding uncertainties were corrected for both baseline and thermal transpiration (Poulter et al., 1983). Thermal transpiration is relevant because our capacitance manometer operates at 45 °C whereas the volumes in the line were at ambient laboratory temperature (19–22 °C). During measurements, laboratory temperatures were monitored to account for volume changes from thermal expansion, but these volume change estimates were well below the detection limit of the instrumentation (∼ 1 fcc, femto−cm3), and therefore are ignored. Table 3 shows the results of one set of expansion experiments (Fig. 5) using the larger Al rod as the VS. The value for VK reported in Table 4 is an average of multiple expansion experiments using combinations of Al rods and Si cubes.
5.5 Determining tank and pipette volumes
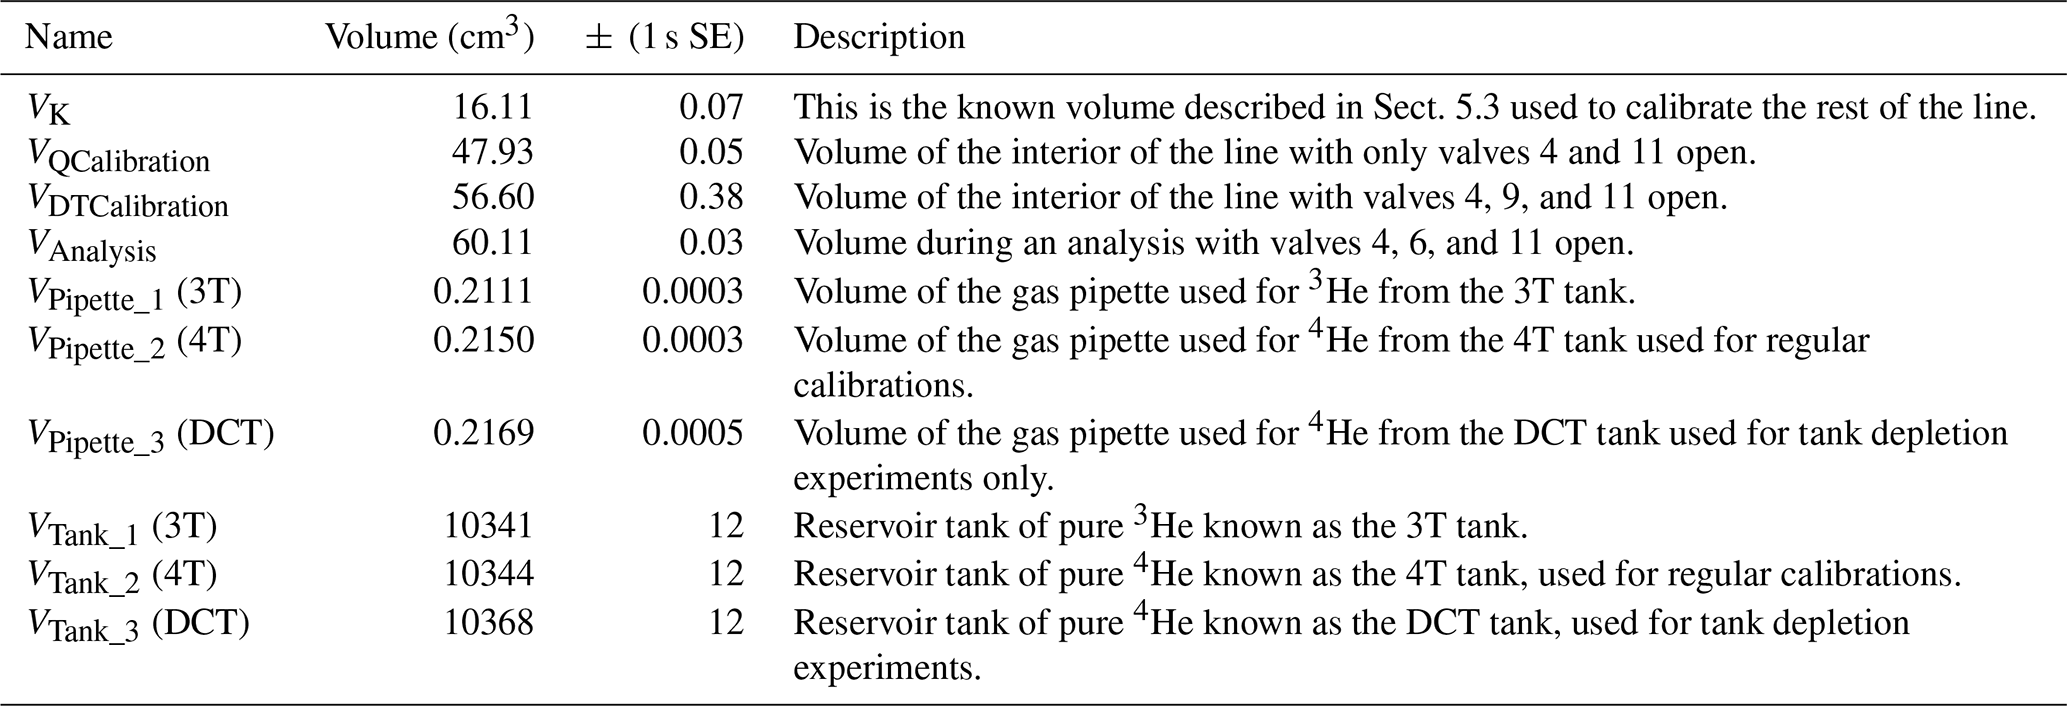
Once we were confident in the value of VK, volumes for the rest of the vacuum line were determined sequentially using Boyle's law and the capacitance manometer. Multiple gas expansion experiments were run on each volume to ensure reproducibility and determine measurement uncertainties. The volume of the pipettes, for example, were measured 3–6 times using different loading pressures, with the resultant 1 s SE on volume determinations < 0.5 %. Table 4 reports all measured volumes. Figure 4 illustrates how uncertainties were propagated for these values.
The volumes of the three reservoir tanks were more difficult to measure using this approach than the other line volumes for several reasons. First, each tank volume is much larger than any other volume, so when the higher pressure in the relatively small line volume (∼ 50 cm3) was expanded into the much larger tank volume (∼ 10 000 cm3), the final tank pressure of ∼ 5 mtorr, was near the minimum sensitivity of the capacitance manometer. Second, the gas can only access the tanks through the pipettes, which do not have high conductance, such that it took a long time (∼ 15 min) for pressures to equilibrate once expanded. During gas expansion the volume being measured is not pumped, so with very long equilibration times comes corresponding slow increases in pressure. These pressure increases are irrelevant for the higher pressure measurements on the other, smaller line volumes. However, because the tank expansions yield much lower pressures at the limit of the capacitance manometer's measurement range, small pressure increases due to extended equilibration durations add uncertainty to the tank volume measurements. Third, impurities (which are slowly removed by gettering) and the slow gas accumulations that happen when volumes aren't pumped can make it difficult to determine when the pressure has actually equilibrated. Finally, because of the low conductance through the pipettes, pumping and properly evacuating the tanks after an expansion experiment was time consuming, limiting the number of full volume measurements that were feasible. There are other, more direct ways to measure tank volumes, notably filling the tank with water and determining the mass, however our tank design includes permanent getters which would be damaged by water.
To circumvent the above challenges, an improved approach would be to fill the tank and interior of the line to ∼ 1000 mtorr, close off the tank, evacuate the line, and then expand the gas trapped in the tank into the rest of the line. This strategy would require measuring pressures of ∼ 1000 and ∼ 995 mtorr, which are well within the calibration range of the manometer. This evacuation and expansion routine can be efficiently repeated multiple times, because the same gas load in the tank can be used rather than fully evacuating the tank before repeating the measurements.
Table 5Reservoir tank pressures and depletion corrections.
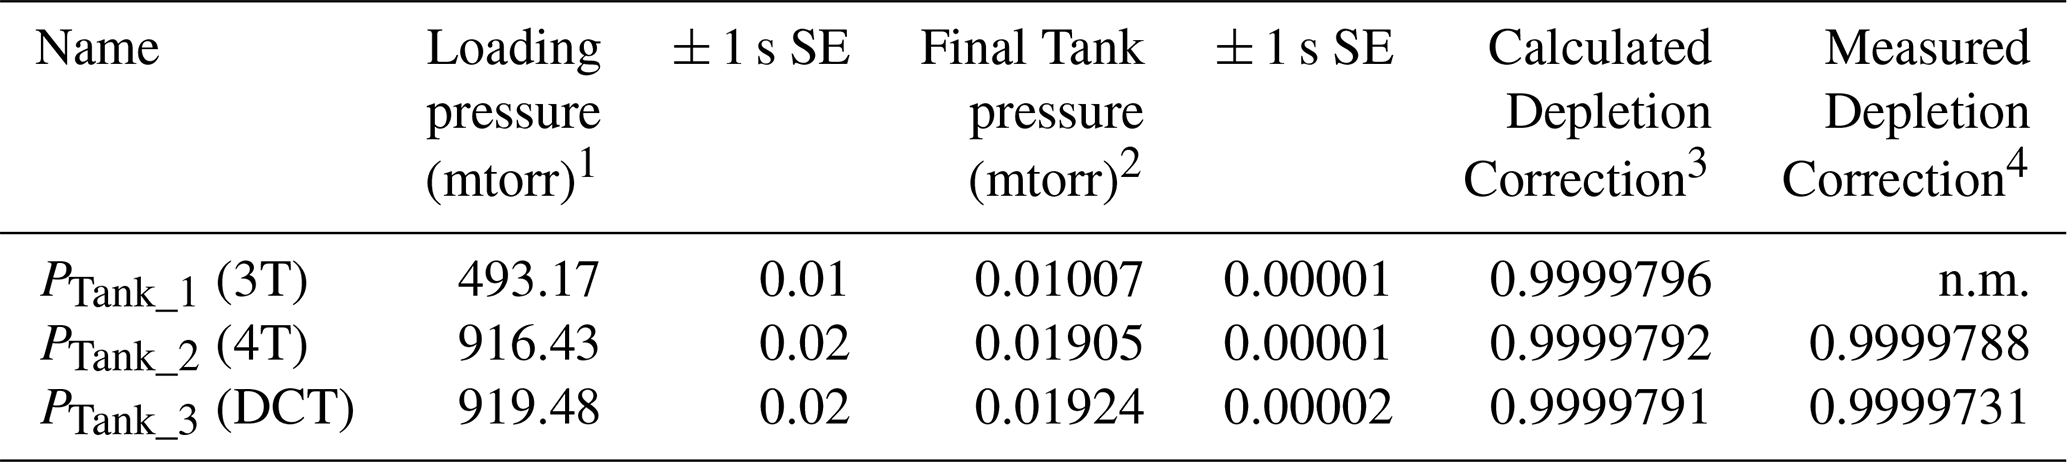
1 The pressure of the gas in the pipette before being expanded into the evacuated reservoir tank (see Sect. 5.5). 2 The pressure of gas in the reservoir tank calculated using the volume of the tank and pipette (see Sect. 5.5). 3 The depletion correction calculated by the measured volumes of the pipette and tank (see Eq. 1 and Sect. 5.1). 4 The depletion correction measured by repeated tank depletion experiments (see Sect. 5.1). Depletion on the 3T cannot be measured directly. n.m.: not measured.
Our existing, calibrated He line enabled us to check our volume measurements (Table 5) by introducing a known amount of 4He into the Jimbochron for analysis, and comparing the results to those predicted from the volume calibrations. Because the pipette volumes determined metrologically as described above were reproducible and did not experience the same problems described with the tank volume determinations, the small discrepancy observed in this experiment suggests that the tank volume measurements were slightly too small. This tank volume discrepancy yields an estimated depletion correction for the 4T tank that differs by only 0.00004 %. This difference in the depletion correction is not significant because the tank depletion rate will be continually measured and refined as described above. The difference in the volume measurement would create a small discrepancy in the calculated amount of 4He in the initial shot, which would impart a small but systematic error in He determinations if not addressed. We expect that the small tank volume discrepancy would be eliminated by the improved tank measurement strategy described above.
5.6 Tank filling and He pressures
For measurements of unknown 4He amounts during regular use of the line, the 3He spike shots and 4He calibration shots should ideally be similar in size to the 4He yielded by a typical sample. To achieve this objective, the target pressure for each reservoir tank was ∼ 0.01 mtorr. Given the measured volumes of the tanks and pipettes, this tank pressure would deliver ∼ 100–200 fmol of gas for the 3He spikes and 4He calibration shots, which is close to the median expected sample size for unknowns.
In preparation for tank filling, the tanks, pipettes, and line were first baked at ∼ 200 °C for ∼ 48 h while being pumped by both turbo and ion pumps to ensure as evacuated a volume and as low a pressure as possible (pressures based on ion pump currents were < 1 × 10⁻⁹ torr). The tanks are pumped through the pipettes, which have low conductance, necessitating the long baking and pumping time. The target tank pressures are significantly lower than can be directly measured by any commercially available absolute capacitance manometer. The proper pressure in each tank was therefore achieved by loading each pipette with ∼ 1 mtorr of either 3He or 4He (gettered extensively to ensure purity), which was expanded into the evacuated tank. The volume of He in each shot, as well as the depletion correction of the tanks owing to successive shots, can then be calculated directly from the volumes of the tank and pipette and the starting pressure of pure gas in the tank (Table 5).
The new, custom He analysis line in the CU TRaIL facility is now fully operational and making automated, high-precision measurements of small volumes of He from sample materials. Designing and building the apparatus in-house, as well as developing custom software for communication and automation, means that the Jimbochron can be more easily repaired and upgraded than off-the-shelf instruments. Building a customized line can also be cost-effective; at the time of construction the total cost of the components required to build the Jimbochron was less than USD 160 000. Future expansion plans include the addition of a CRH setup (Idleman et al., 2018) as well as more vacuum pumps to allow for more specific valve sequencing and to decrease the time required to evacuate the line between analyses. We also plan to replace both the sample and mass spectrometer chambers with smaller volume components.
The high sensitivity of the Jimbochron due to a relatively small internal line volume, more sensitive mass spectrometer, and optimized tuning enables precise measurements of small gas amounts (< 0.1 fmol). This capability allows for smaller sampling volumes, more targeted He spot analyses, higher-precision measurements on younger samples, analysis of smaller grains, and higher spatial resolution mapping of individual crystals.
Measurements of He from secondary mineral standards, including Durango fluorapatite (e.g., McDowell et al., 2005) and Juina zircon (currently used as an in-house standard, Zeigler et al., 2025), have demonstrated the ability of the Jimbochron to accurately and precisely measure typical amounts of 4He released during laser-ablation analysis (∼ 0.1–1000 fmol). Full laser-ablation date calculations, which require additional measurements, are also consistent with expected values. Automated analytical sequences have also successfully created He abundance maps of individual zircon crystals. We expect further performance improvements as we test and gain experience with a variety of analytical conditions and continue experimenting with grain mounting materials, sample preparation protocol, and analytical (QMS) settings.
Example LabView® code described in this contribution is archived on Zenodo (Metcalf, 2026) and can be accessed via https://doi.org/10.5281/zenodo.20402610.
All relevant data is available in the text of the contribution.
JRM and RMF conceptualized the project and acquired funding; JRM constructed the line and performed the calibration experiments; JRM and RMF prepared the manuscript.
The contact author has declared that neither of the authors has any competing interests.
Publisher's note: Copernicus Publications remains neutral with regard to jurisdictional claims made in the text, published maps, institutional affiliations, or any other geographical representation in this paper. The authors bear the ultimate responsibility for providing appropriate place names. Views expressed in the text are those of the authors and do not necessarily reflect the views of the publisher.
We wish to thank Stephen Cox, Bjarne Friedrichs, and William Guenthner for their thorough and insightful reviews that improved the clarity and quality of this manuscript, and Marissa Tremblay for her comprehensive and efficient editorial handling of the paper.
NSF award EAR-1920648 to RMF and JRM provided funding for all components needed to build, automate, and calibrate the Jimbochron. NSF award EAR-2311978 to RMF and JRM has supported ongoing testing, refinement, and use of the Jimbochron.
This paper was edited by Marissa Tremblay and reviewed by Stephen Cox, Bjarne Friedrichs, and William Guenthner.
Danišík, M., McInnes, B. I. A., Kirkland, C. L., McDonald, B. J., Evans, N. J., and Becker, T.: Seeing is believing: Visualization of He distribution in zircon and implications for thermal history reconstruction on single crystals, Science Advances, 3, e1601121, https://doi.org/10.1126/sciadv.1601121, 2017.
Farley, K. A., Reiners, P. W., and Nenow, V.: An Apparatus for High-Precision Helium Diffusion Measurements from Minerals, Anal. Chem., 71, 2059–2061, https://doi.org/10.1021/ac9813078, 1999.
Gautheron, C., Pinna-Jamme, R., Derycke, A., Ahadi, F., Sanchez, C., Haurine, F., Monvoisin, G., Barbosa, D., Delpech, G., Maltese, J., Sarda, P., and Tassan-Got, L.: Technical note: Analytical protocols and performance for apatite and zircon (U–Th) He analysis on quadrupole and magnetic sector mass spectrometer systems between 2007 and 2020, Geochronology, 3, 351–370, https://doi.org/10.5194/gchron-3-351-2021, 2021.
Henins, I.: Precision density measurement of silicon, J. Res. Nbs. A Phys. Ch., 68, 529, https://doi.org/10.6028/jres.068A.050, 1964.
House, M. A., Farley, K. A., and Stockli, D.: Helium chronometry of apatite and titanite using Nd-YAG laser heating, Earth Pl. Sc. Lett., 183, 365–368, https://doi.org/10.1016/s0012-821x(00)00286-7, 2000.
Idleman, B. D., Zeitler, P. K., and McDannell, K. T.: Characterization of helium release from apatite by continuous ramped heating, Chem. Geol., 476, 223–232, https://doi.org/10.1016/j.chemgeo.2017.11.019, 2018.
Lanphere, M.A., and Dalrymple, G.B.: First-Principles Calibration of 38Ar Tracers: Implications for the Ages of 40Ar/39Ar Fluence Monitors, USGS Professional Paper 1621, US Department of the Interior, US Geological Survey, https://doi.org/10.3133/pp1621, 2000.
Lesnek, A. J., Licciardi, J. M., Hidy, A. J., and Anderson, T. S.: Technical note: Optimizing the in situ cosmogenic 36Cl extraction and measurement workflow for geologic applications, Geochronology, 6, 475–489, https://doi.org/10.5194/gchron-6-475-2024, 2024.
McCabe, P. R. and Utz, A. L.: A convenient means of securing gaskets during assembly of vertically oriented knife-edge flanges, J. Vac. Sci. Technol. A, 17, 673–673, https://doi.org/10.1116/1.581636, 1999.
McDowell, F. W., McIntosh, W. C., and Farley, K. A.: A precise 40Ar–39Ar reference age for the Durango apatite (U–Th)/He and fission-track dating standard, Chem. Geol., 214, 249–263, https://doi.org/10.1016/j.chemgeo.2004.10.002, 2005.
Metcalf, J.: Jimbochron LabView Modules, Zenodo [code], https://doi.org/10.5281/zenodo.20402610, 2026.
Morgan, L. E., Postma, O., Kuiper, K. F., Mark, D. F., Plas, W. van der, Davidson, S., Perkin, M., Villa, I. M., and Wijbrans, J. R.: A metrological approach to measuring 40Ar* concentrations in K-Ar and mineral standards, Geochem. Geophy. Geosy., 12, https://doi.org/10.1029/2011gc003719, 2011.
Poulter, K., Rodgers, M.-J., Nash, P., Thompson, T., and Perkin, M.: Thermal transpiration correction in capacitance manometers, Vacuum, 33, 311–316, https://doi.org/10.1016/0042-207x(83)90098-2, 1983.
Reynolds, J. H.: High Sensitivity Mass Spectrometer for Noble Gas Analysis, Rev. Sci. Instrum., 27, 928–934, https://doi.org/10.1063/1.1715415, 1956.
Ritter, B., Vogt, A., and Dunai, T. J.: Technical Note: Noble gas extraction procedure and performance of the Cologne Helix MC Plus multi-collector noble gas mass spectrometer for cosmogenic neon isotope analysis, Geochronology, 3, 421–431, https://doi.org/10.5194/gchron-3-421-2021, 2021.
Stracke, A., Scherer, E. E., and Reynolds, B. C.: Application of Isotope Dilution in Geochemistry, in: Treatise on Geochemistry, edited by: McDonough, W. F., Elsevier, 71–86, https://doi.org/10.1016/B978-0-08-095975-7.01404-2, 2014.
Sverdlin, A.: Properties of Pure Aluminum, in Handbook of Aluminum, New York, Marcel Dekker, Inc., 1296 pp., ISBN 0824704940, 2003.
Webster, R. K.: Isotope Dilution Analysis, in: Advances in Mass Spectrometry, Pergamon, 103–119, https://doi.org/10.1016/B978-0-08-009210-2.50013-4, 1959.
Yakubovich, O. V., Konstantinova, N. P., Anosova, M. O., Podolskaya, M. M., and Adamskaya, E. V.: Technical note: An analytical approach for (U–Th) He dating of goethite by sample encapsulation in quartz ampoules under vacuum, with an example from the Amerasian Basin, Arctic Ocean, Geochronology, 6, 653–664, https://doi.org/10.5194/gchron-6-653-2024, 2024.
Zeigler, S. D., Flowers, R. M., Pearson, D. G., Courtney-Davies, L., Kjarsgaard, B. A., Richardson, S. H., Berkhahn, K., Metcalf, J. R., and Cabral-Neto, I.: Paired megacrystic zircon and dating reveals kimberlite eruption ages, protracted emplacement histories, and insights into megacryst genesis, Chem. Geol., 695, 123033, https://doi.org/10.1016/j.chemgeo.2025.123033, 2025.
- Abstract
- Introduction
- Design principles and considerations
- Construction
- Communication and automation
- Determining volumes and calibrating depletion corrections from first principles
- Summary
- Code availability
- Data availability
- Author contributions
- Competing interests
- Disclaimer
- Acknowledgements
- Financial support
- Review statement
- References
- Abstract
- Introduction
- Design principles and considerations
- Construction
- Communication and automation
- Determining volumes and calibrating depletion corrections from first principles
- Summary
- Code availability
- Data availability
- Author contributions
- Competing interests
- Disclaimer
- Acknowledgements
- Financial support
- Review statement
- References