
the Creative Commons Attribution 4.0 License.
the Creative Commons Attribution 4.0 License.
 | 27 May 2026
Novel insights into the post-IR IRSL200 signal bleachability of single-grain K-feldspars in fluvial modern analogues from the Southern Central Andes, Chile
Svenja Riedesel
Louise Karman-Besson
Max Hellers
Anne Guyez
Stéphane Bonnet
Tony Reimann
Post-infrared infrared stimulated luminescence (post-IR IRSL) signals from potassium feldspars are gaining prominence in both luminescence dating and luminescence-based sediment tracing techniques. To enhance the accuracy and reliability of these applications, it is essential to develop a comprehensive understanding of how post-IR IRSL signals undergo bleaching. While previous studies have explored post-IR IRSL bleachability using multi-grain approaches, a systematic single-grain investigation on modern analogues has not been conducted. In this study, we examined the bleaching behaviour of the post-infrared infrared stimulated luminescence signal measured at 200 °C (post-IR IRSL200) at the single-grain level in eleven modern floodplain samples from the tectonically active Southern Central Andes. Our study demonstrated considerable variation in the residual doses following 2 d of laboratory solar simulator bleaching across the sample set. This variability was evident not only between different samples but also among individual grains within the same sample. Thus, we evaluated the influence of bleaching duration, grain-specific geochemical composition, catchment-scale lithological variability, and the size of the natural dose on the laboratory-measured residual doses.
Our laboratory bleaching experiments in which single grains were given a fixed regenerated dose of 30 Gy prior to solar simulator exposure showed similar post-IR IRSL200 signal bleaching behaviour across four different samples, reaching a plateau based on normalised luminescence signal after 2 d of exposure to solar simulator light. While individual grains exhibited a wide range of bleaching rates, this variability did not account for the spread in residual dose values. Notably, extended light exposure reduced variability in signal intensity, underscoring its role in dose homogenisation. Geochemical analysis of major oxides showed no significant correlation with either residual dose magnitude or bleaching rate, suggesting that mineral composition (including K-concentration) does not influence bleaching efficiency at the individual grain level. Furthermore, bleaching behaviour remained consistent across samples regardless of catchment lithology, with no discernible relationship between lithological units and remnant dose (defined as the natural dose remaining at the time of deposition and burial) or residual dose values. Most importantly, we identified a strong positive linear correlation (R2= 0.89) between residual dose and natural remnant dose, revealing dose-dependent bleaching efficiency and the presence of a negligible unbleachable component at the time of deposition. This relationship between residual dose and natural remnant dose also suggests that while the youngest samples (with low natural remnant dose) could reach zero residual dose, the relatively older samples (with more than 10 Gy of natural remnant dose) could show a significant amount of residual dose. By integrating insights on bleachability with the information on the unbleachable component and remnant doses derived from modern analogues, we highlight the limitations of correcting palaeodoses by directly using either residual or remnant doses and evaluate three context-sensitive correction strategies. Finally, we discuss how residual doses can be leveraged to more reliably identify well-bleached grains, enhancing the accuracy of luminescence-based sediment tracing applications.
- Article
(3732 KB) - Full-text XML
-
Supplement
(2036 KB) - BibTeX
- EndNote


Over the past decades, optically stimulated luminescence (OSL), infrared stimulated luminescence (IRSL), and post-infrared infrared stimulated luminescence (post-IR IRSL) dating have been used extensively in Quaternary research to develop chronologies across diverse environmental settings (e.g., Wallinga, 2002; Jain et al., 2004; Bateman, 2008; Rittenour, 2008; Reimann et al., 2011, 2012; Chamberlain et al., 2017; Brill et al.,2018; Bonnet et al., 2019). One of the essential preconditions of these dating techniques is the pre-burial bleaching event, which resets the luminescence signal accumulated in the mineral grains after burial due to their exposure to external radiation in the surrounding sediments, incoming cosmic radiation (Preusser et al., 2008), and varying contributions from internal radiation (Zhao and Li, 2005). However, incomplete or partial resetting of the previously accumulated luminescence signal has been frequently reported, especially in fluvial and glacio-fluvial settings (Wallinga 2002; King et al., 2013; Bonnet et al., 2019), creating a major source of uncertainty in age estimates. While incomplete bleaching poses a significant challenge for luminescence dating, it offers valuable opportunities for luminescence-based sediment tracing of geomorphic processes (Bonnet et al., 2019; Chamberlain and Wallinga, 2019; Rhodes and Leathard, 2022; Guyez et al., 2022, 2023; de Boer et al., 2024).
Bleaching of the luminescence signal in various environmental settings is primarily influenced by external geomorphic and environmental factors, which determine the duration of sunlight exposure required for bleaching (King et al., 2014; Reimann et al., 2015; Brill et al., 2018; Chamberlain and Wallinga, 2019). However, it is well known that the rate and degree of bleaching are also impacted by the choice of minerals and the type of luminescence signal used. For instance, K-feldspar IRSL and post-IR IRSL signals are especially susceptible to incomplete bleaching, as exposure to daylight resets their luminescence signal more slowly than the quartz OSL signal (Godfrey-Smith et al., 1988; Thomsen et al., 2008; Buylaert et al., 2012; Kars et al., 2014; Reimann et al., 2015; Zhang et al., 2023). Therefore, improving the use of K-feldspars for luminescence dating and luminescence-based sediment tracing in complex geomorphic contexts requires a detailed and quantitative understanding of the bleachability of the K-feldspar luminescence signals, particularly the post-IR IRSL signals.
Previous studies based on multi-grain measurements have demonstrated that low-temperature post-IR IRSL signals can be effectively bleached, resulting in residual doses, i.e., the luminescence dose remaining after laboratory bleaching, typically below 2 Gy (Reimann et al., 2011; Reimann and Tsukamoto, 2012). However, other investigations using relatively higher temperature post-IR IRSL protocols have reported a broader range of residual doses, reaching up to ∼ 40 Gy following laboratory bleaching (Stevens et al., 2011; Thiel et al., 2011; Alexanderson and Murray, 2012; Buylaert et al., 2012; Lowick et al., 2012; Sohbati et al., 2012; Kars et al., 2014; Yi et al., 2016). Notably, Sohbati et al. (2012), Buylaert et al. (2012), and Yi et al. (2016) found a positive correlation between residual doses and the corresponding natural burial doses, suggesting that incomplete bleaching is often inherited from the depositional history. Also, Kars et al. (2014) observed similar positive correlation between residual doses and the corresponding natural burial doses and suggested that the residual dose depends on the bleaching time and on the bleaching conditions. In addition, several studies have identified an unbleachable signal component in post-IR IRSL measurements, which complicates signal resetting and dose interpretation (Yi et al., 2016; Brill et al., 2018; Zhang et al., 2023). Further complexity arises from the investigations of modern analogues (i.e., present-day depositional environments used as references for past depositional environments), which highlight the occurrence of remnant doses, defined as the natural dose remaining at the time of deposition and burial (Kars et al., 2014). These remnant doses can be substantial, with values reaching up to ∼ 50 Gy (Thomsen et al., 2008; Buylaert et al., 2009; Madsen et al., 2011; Alexanderson and Murray, 2012; Buylaert et al., 2012; Murray et al., 2012), raising major concerns regarding bleaching efficiency across a variety of modern depositional settings.
Moreover, single-grain luminescence studies have highlighted considerable inter-grain variability in bleaching behaviour, leading to substantial differences in residual dose estimates (Smedley et al., 2015; Choi et al., 2024). For example, Smedley et al. (2015), working with aeolian and glaciofluvial samples, reported grain-to-grain variability in laboratory bleaching rates, resulting in variable residual dose estimates. However, they found no clear relationship between post-IR IRSL bleaching rates and the equivalent dose (De) values. In a more recent study, Choi et al. (2024) exposed two soil samples to natural sunlight for controlled durations and observed variable post-IR IRSL residual doses across individual grains. Their findings revealed a positive correlation between both De and residual dose with the recuperation dose, a signal component measured during Single-Aliquot Regenerative dose (SAR) protocols related to the zero-dose measurement. This suggests that the recuperation dose may serve as a useful proxy for assessing grain-specific bleachability, potentially enabling the identification of well-bleached grains within heterogeneously bleached samples. Additionally, considering the chemically complex nature of feldspars, further challenges may stem from grain-to-grain variations in K-concentration within K-feldspar grains, primarily affecting the internal dose rate. Although recent investigations (Buylaert et al., 2018; Smedley et al., 2019; Maßon et al., 2024) observed no relationship between internal K-concentration and either De estimates or luminescence signal intensity, it remains unclear whether K-concentration influences single-grain bleaching rates and consequently residual doses.
Collectively, these studies emphasise the complex and grain-specific nature of K-feldspar luminescence signal resetting by natural and artificial sunlight, highlighting the importance of single-grain analyses for accurately capturing variability in both residual and remnant doses. This complexity becomes particularly significant in dynamic depositional settings, where bleaching is highly heterogeneous. In such environments, averaging effects arising from multi-grain measurements can mask the true luminescence signal characteristics of distinct grain populations, including those that are well-bleached, partially bleached, or saturated (e.g., Duller, 2008; Bonnet et al., 2019; Guyez et al., 2022, 2023). As a result, meaningful signal distinctions may be obscured, potentially compromising accurate dose estimation and depositional setting interpretation. However, our current understanding of the post-IR IRSL bleaching process under laboratory and natural conditions is largely based on multi-grain measurements (e.g., Lowick et al., 2012; Buylaert et al., 2012; Alexanderson and Murray, 2012; Kars et al., 2014). Existing single-grain studies on this topic are limited in both sample size and the range of depositional settings examined (Smedley et al., 2015; Choi et al., 2024), especially in the context of modern analogues (e.g., Alexanderson and Murray, 2012). Here, we address this research gap through a systematic investigation of laboratory and natural bleaching of single grains from eleven modern fluvial analogues spanning 28 to 38° S in Chile, a region characterised by active tectonics (Strecker et al., 2007) and a pronounced climatic gradient (Garreaud et al., 2009). Given the geologic and geomorphic diversity across these catchments, our study aims to (1) investigate how bleaching duration, grain-specific geochemical composition, catchment-scale lithological variability, and natural burial dose influence the bleaching characteristics and residual doses of the post-infrared infrared stimulated luminescence signal measured at 200 °C (post-IR IRSL200) at the single-grain level, and evaluate how these laboratory observations compare with natural bleaching, and (2) assess how insights into bleaching behaviour from modern analogues can inform methodological decisions in dating sedimentary archives and guide applications in luminescence-based sediment tracing.
2.1 Study area and sampling strategy
The Southern Central Andes (27 to 40° S) of Chile (Rodriguez Piceda et al., 2020) are characterised by several high peaks (> 6000 m), variable volcanic and tectonic activity, as well as a range of climatic conditions influenced by both latitude and altitude. Climate in this region transitions from arid to semi-arid in the northern sectors to a Mediterranean regime in the central-southern areas (Aceituno et al., 2021). This prominent climatic gradient results in a sequence of catchments showing different environmental conditions (e.g., vegetation cover, Fig. 1). In this study, we selected 11 catchments that drain roughly perpendicularly to the Andean Mountain range, with outlets located at the foot of the main Cordillera (Fig. 1a, Table S1 in the Supplement). All catchments of the study area show remarkable latitudinal variations in their morphological features resulting from the interaction between volcanic and tectonic processes and climate. The northernmost catchment experiences arid conditions, with a daily average rainfall of less than 0.4 mm (Table S2), while the southernmost catchment, influenced by south-westerly winds, exhibits humid conditions with average rainfall exceeding 4 mm d−1 (Table S2). The mean normalised difference vegetation index (NDVI) closely follows the rainfall variations, low in the north (0.045) and relatively high in the south (0.281) (Table S2). The Southern Central Andes also features a wide range of slopes, glacier cover, and lithologies (Fig. 1b, Tables S1 and S2), making it a natural laboratory for studying Earth's surface processes and for testing the influence of these processes on the bleachability of the luminescence signal in a more diverse and dynamic landscape.
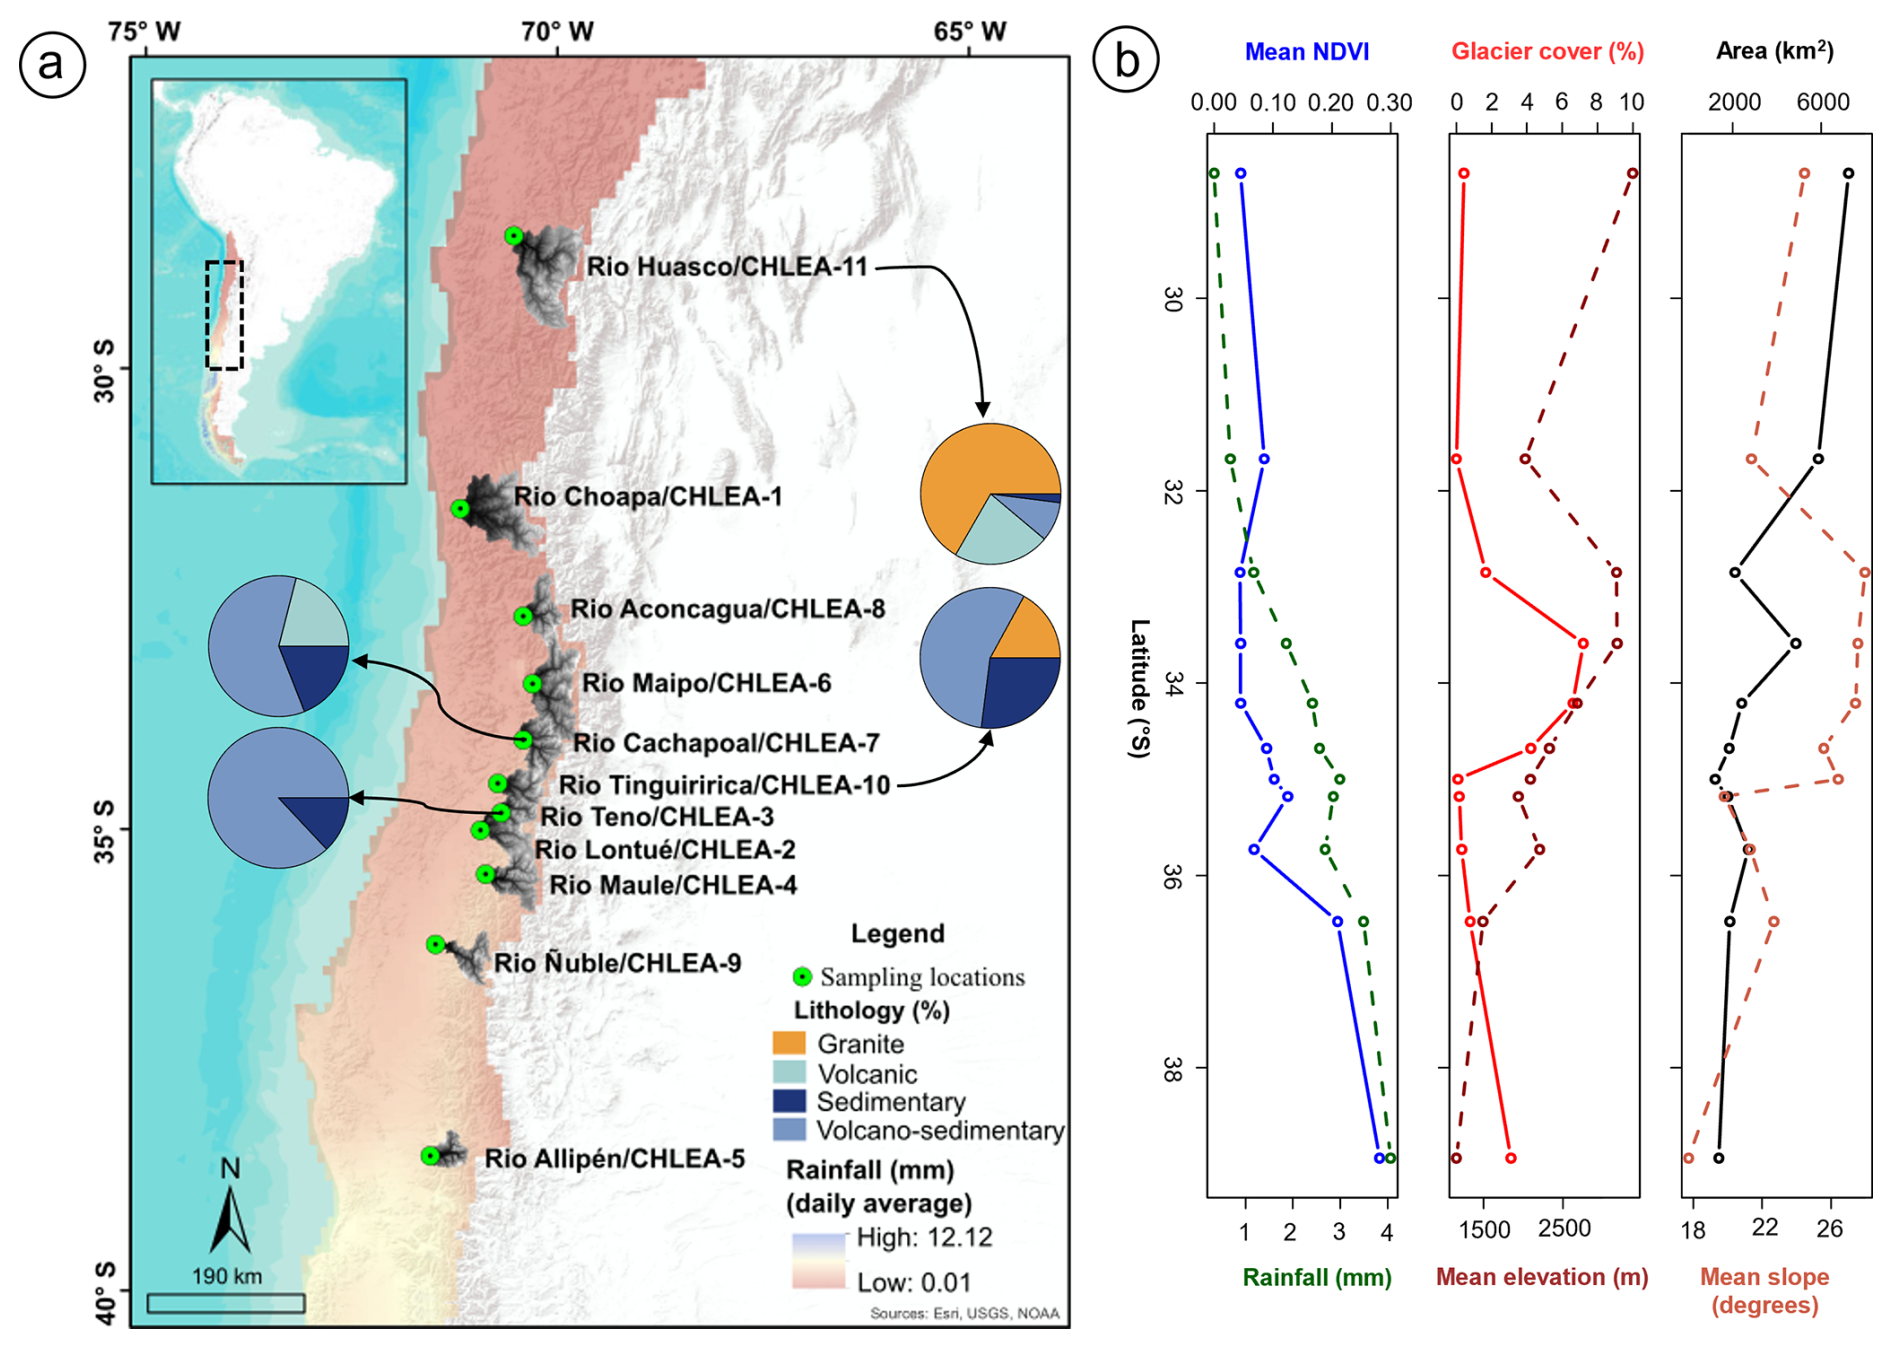
Figure 1(a) Map of the study area displaying the eleven catchments considered in this study. A 30 m resolution digital elevation model has been used to delineate catchments, considering sampling locations as outlets. Each catchment highlights the river name and corresponding sample ID, with green points marking the sampling locations. The daily average rainfall (mm) map [GPM_3IMERGDF v06] (Huffman et al., 2023) shows a precipitation gradient from north to south. Pie charts depict the lithological composition of four catchments (Table S1) from which samples were selected for the bleaching experiment. Base map: Esri, USGS, and NOAA | Powered by Esri. (b) spatial variations in catchment properties along a north to south trend (with the latitudinal distribution of catchments). Analysed catchment properties include mean normalised difference vegetation index (NDVI), daily average rainfall (mm), glacier cover ( %), mean elevation (m), total catchment area (km2), and mean slope (degrees). Details of all these parameters are provided in Table S2.
Samples were collected during a field campaign in 2022, covering a latitudinal stretch of approximately ten degrees (from 28 to 38° S). Samples were collected by hammering the opaque luminescence sampling tubes into the sediment sections on the modern floodplain (Fig. 2). Eleven samples were collected from eleven catchments (Fig. 1, Table S1). All sampling sites were located at the foot of the main Andean Cordillera to minimise any modulation of erosional signal by downstream storage or reworking and to directly assess the influence of landscape variables on the luminescence signal, as fluvial deposits from these locations provide an optimal record of millennial erosional processes and rates shaping the landscape and supplying sediment to the fluvial network.
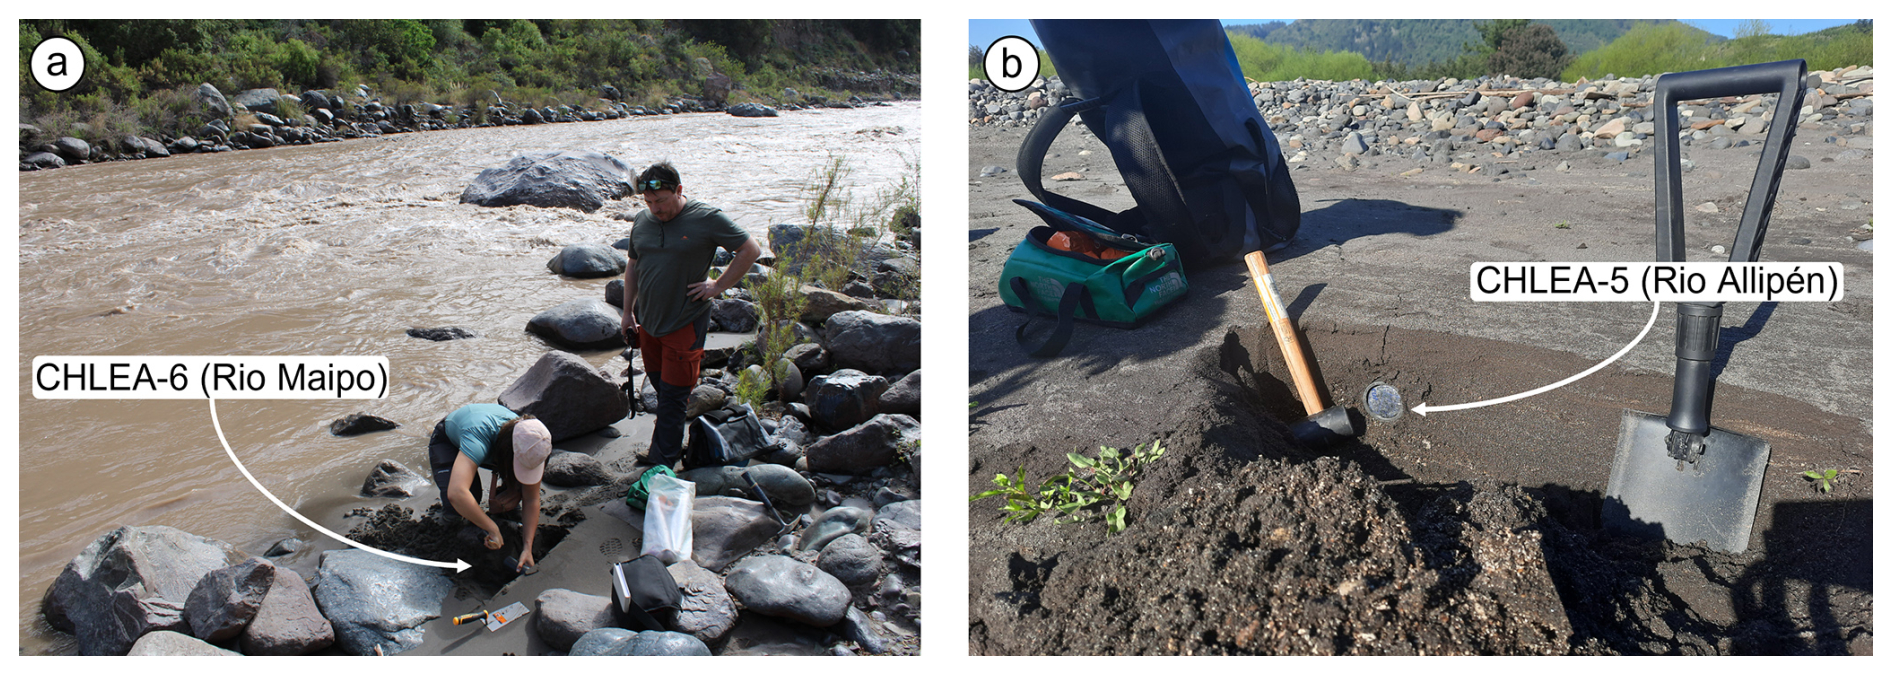
Figure 2Luminescence sampling on modern floodplains of the Maipo (a) and Allipén (b) rivers during the field campaign in 2022.
2.2 Sample preparation
Samples were prepared under subdued red-light conditions at the Cologne Luminescence Laboratory (CLL, University of Cologne). Hydrochloric acid (HCl, 10 %) and hydrogen peroxide (H2O2, 10 %) were used to remove carbonates and organic material, respectively. Sodium oxalate (Na2C2O4, 0.01 N) was used to disperse the sediment particles. After chemical treatment, the samples were sieved to obtain the 200–250 µm grain size fraction. This sieved fraction was used to extract K-rich feldspars through a two-step density separation using a sodium polytungstate solution at 2.58 and 2.53 g cm−3. The second density separation step (with sodium polytungstate density of 2.53 g cm−3) was necessary to remove a pumice fraction from the feldspar extracts. A hand magnet was used to separate any magnetic residue in the feldspar fraction. The remaining non-magnetic fraction was then re-sieved within the target fraction (200–250 µm) before the final luminescence measurement.
2.3 Instrumentation and luminescence measurements
All luminescence measurements were carried out on an automated Risø TL/OSL reader (DA-20) equipped with a 90Sr 90Y beta source for irradiation, delivering a dose rate of ∼ 0.066 Gy s−1 at the sample position, and a single-grain attachment (Bøtter-Jensen et al., 2003). A 140 mW, 830 nm centred IR laser stimulated the grains, and the blue emission (∼ 410 nm) was detected through a combination of a 2 mm Schott BG-39 filter and a 3 mm Corning 7–59 glass filter. A Schott RG-780 filter was inserted in front of the laser to block secondary emissions below 780 nm by the 830 nm laser.
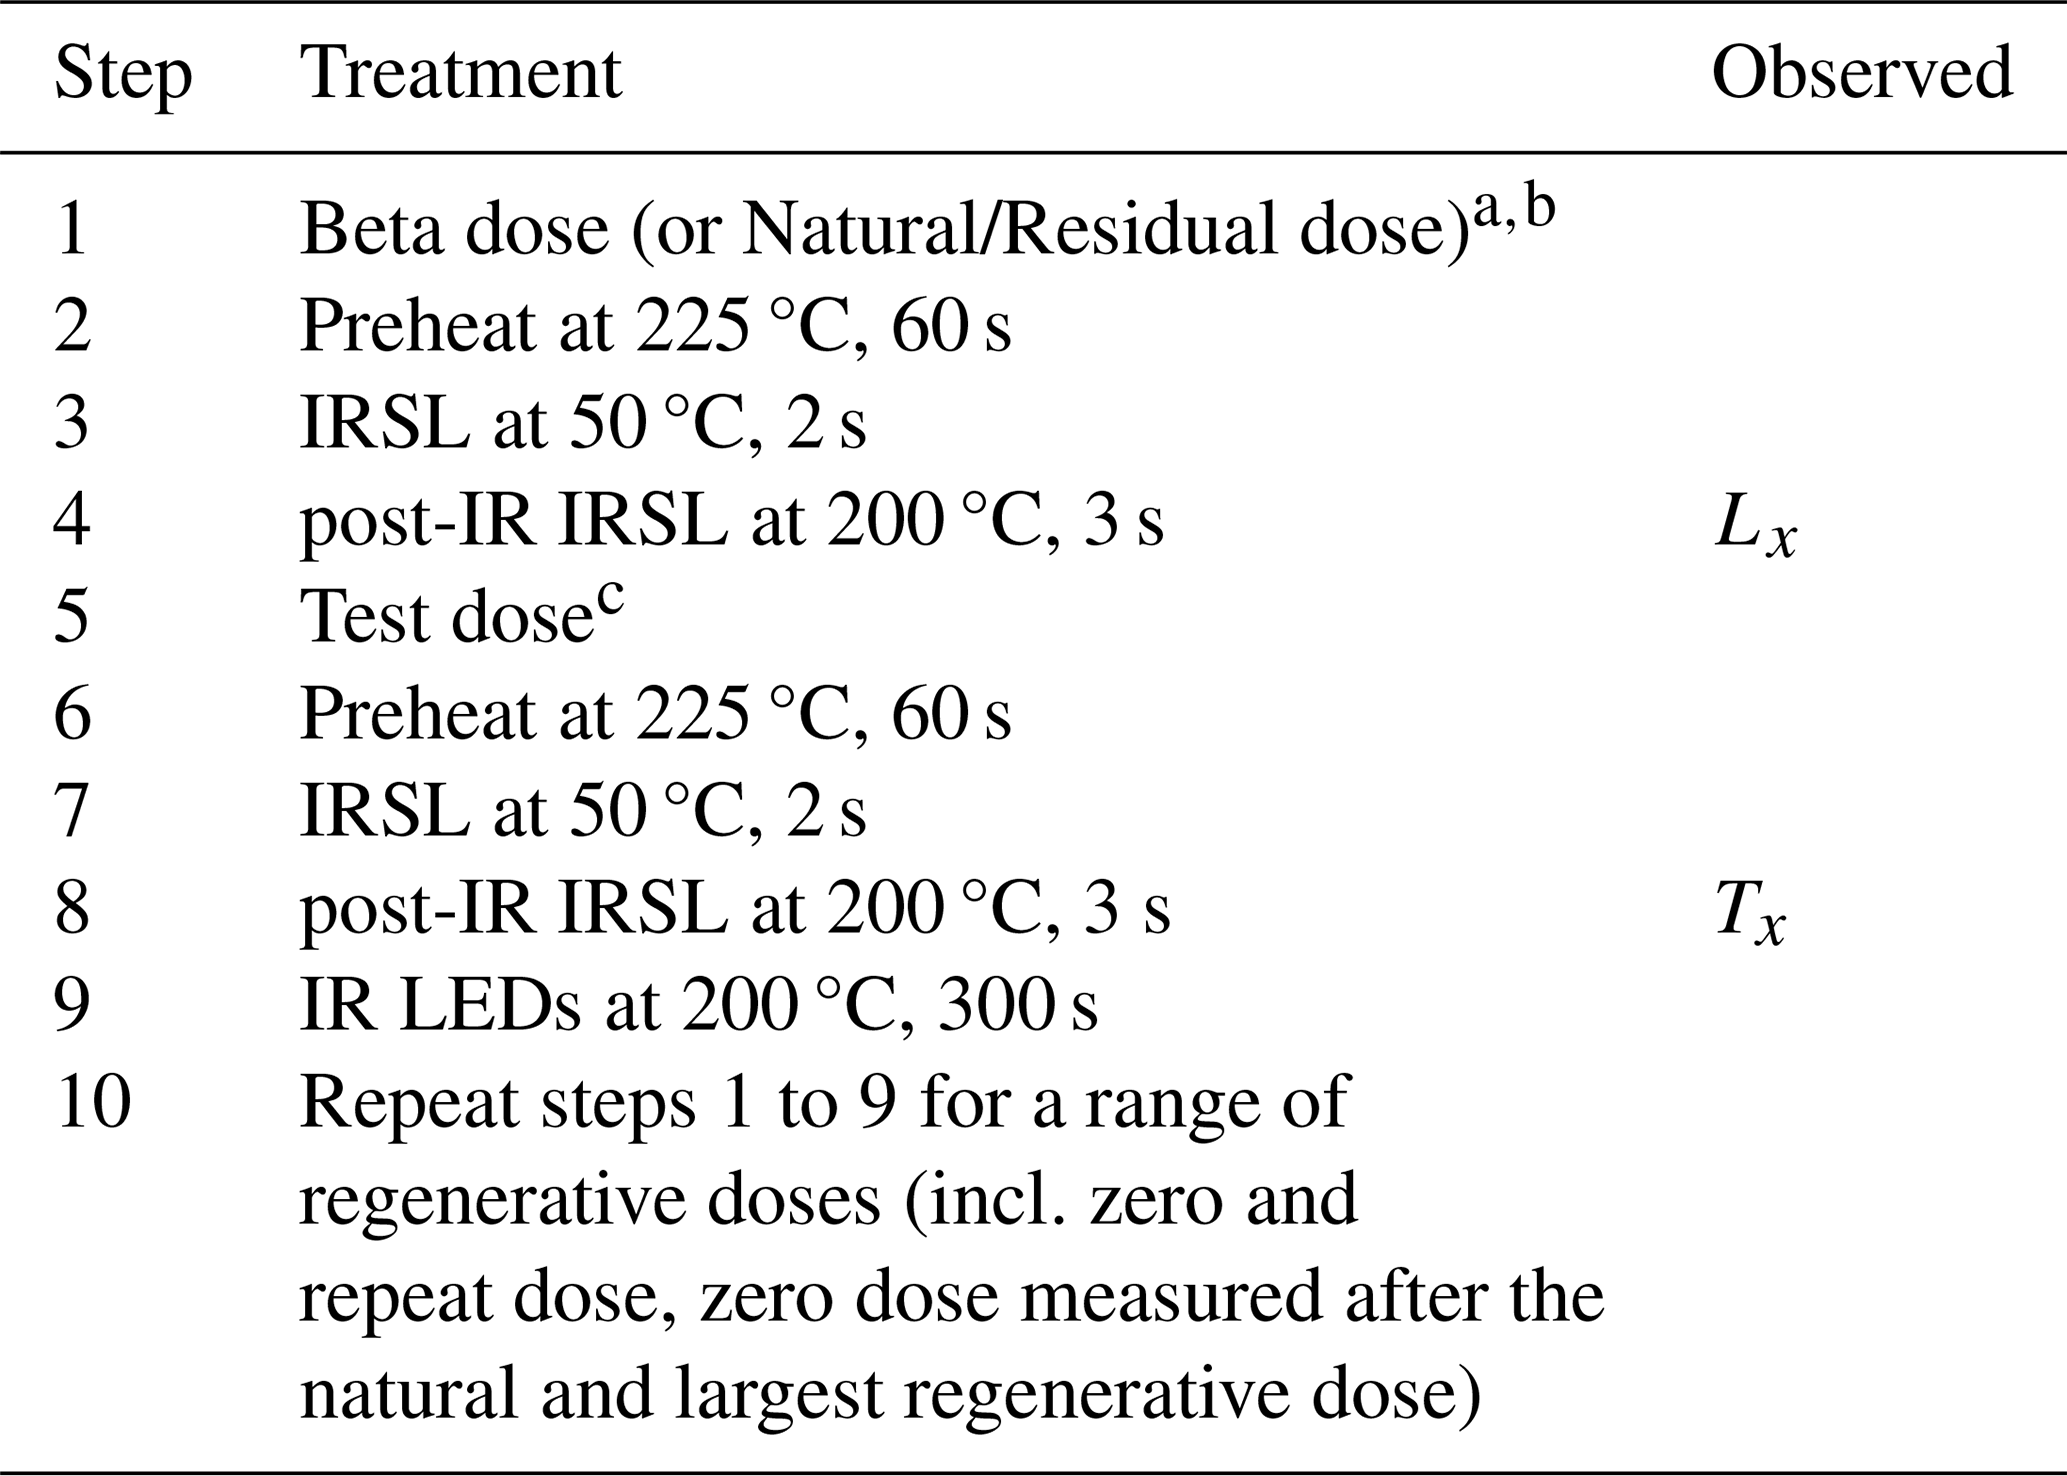
For all De and residual dose (remaining dose after 2 d of bleaching in a Hönle Sol2) measurements, single grains of K-feldspar were mounted in a standard single-grain disc featuring a 10 by 10 grid of 100 holes, each measuring 300 µm in depth and 300 µm in diameter. Grains were then analysed following the protocol outlined in Table 1. From the single-grain luminescence measurements, the net post-IR IRSL200 signal was calculated from the signal integrated over the first 0.25 s with subtraction of the background estimated from the last 0.50 s (Fig. S4 in the Supplement). All De and residual dose estimates were derived and analysed using the numOSL (Peng et al., 2013; Peng and Li, 2017) and the Luminescence package (Kreutzer et al., 2023) within the R environment. A measurement error for the regenerative dose signal (Lx) and the corresponding test dose signal (Tx) of 2 % was used for calculations. Growth curve fitting was performed using a general-order kinetic model (Guralnik et al., 2015), with the fit forced through the origin. The acceptance criteria for both single-grain De and residual dose estimates include a test dose signal intensity following natural dose measurement (Tn) > 3σ above background, relative standard error of Tn≤ 20 %, and recycling ratio within the range of 0.8 to 1.2 (unity ±20 %) for all available recycling points. A figure-of-merit of 15 % was used as a measure of the goodness of growth curve fitting for all single-grain measurements (Peng and Li, 2017; Riedesel et al., 2025). Additionally, grains were rejected if they exhibited any of the following issues: unsuccessful error propagation for De estimates, failure in dose response curve fitting, saturation of the natural signal (), or failure during interpolation of the natural signal onto the dose response curve. To examine the feldspar luminescence signal behaviour and identify the most appropriate measurement protocol for De estimation using single-grains, dose-recovery and residual preheat plateau tests were conducted on two samples (CHLEA-6 and CHLEA-11) using multi-grain aliquots (2 mm diameter) of coarse-grain (200–250 µm) K-feldspar following the protocol outlined in Table S3 and temperature combinations outlined in Table S4. Among the various post-IR IRSL signals evaluated, the post-IR IRSL200 signal provided the most reliable dose recovery results for both samples, with dose recovery ratios ranging from 0.9 to 1.1 (Fig. S1a). Based on this performance, the post-IR IRSL200 protocol was selected for further analysis. To assess the protocol's suitability at the single-grain level, single-grain dose recovery tests were subsequently conducted on four samples (CHLEA-6, CHLEA-9, CHLEA-10, and CHLEA-11) following the protocol in Table S3. While the residual-corrected single-grain dose recovery ratios showed slight underestimation relative to unity (Fig. S2), all samples except CHLEA-11 fell within the acceptable range of 0.9 to 1.1 when 1σ uncertainties were considered. These results thus confirm the effectiveness of the post-IR IRSL200 protocol in accurately recovering known laboratory doses. Additional details regarding the preheat plateau and dose recovery experiments, including kernel density estimate (KDE) plots from single-grain dose recovery tests (Fig. S3), are provided in section S2 of the supplementary material.
Table 1Post-IR IRSL200 measurement protocol. a For equivalent dose (De) measurement, the given regenerative doses were 0, 2, 5, 10, 30, 50, 100, 200, and 400 Gy. b For residual dose measurement, the given regenerative doses were 0, 2, 5, 10, and 30 Gy. c For De measurement, a test dose of 20 Gy was used for all measurements and for residual dose measurement, a test dose of 10 Gy was used for all measurements.
Following De and residual dose measurements using the post-IR IRSL200 protocol (Table 1), the modal equivalent dose (Mode De) and modal residual dose (ModeResidual) were estimated from the single-grain dose distributions using KDE curves. The optimal bandwidth was determined using the Sheather-Jones method, which is well-suited for non-normal distributions (Sheather and Jones, 1991). The mode was defined as the global maximum of the resulting KDE curve. Given that poorly bleached grains carry excess dose and populate the right tail of the distribution, the mode of the resulting right-skewed distribution corresponds to the low-dose peak and serves as a proxy for the best-bleached grain population (Fig. S5). Uncertainty on the Mode De and ModeResidual was quantified using a nonparametric bootstrap resampling procedure (n= 1000 iterations), where each iteration drew a resample of equal size with replacement and re-estimated the KDE mode using the bandwidth derived from the original sample, yielding a 1σ (68 %) confidence interval. In addition, the mean of the single-grain De (Mean De) and residual dose (MeanResidual) distribution and their standard error were also calculated for each sample to characterise the broader distribution.
2.4 Laboratory bleaching experiment
All laboratory bleaching experiments were carried out at the CLL using a Hönle Sol2 (Sol2) laboratory solar simulator following the protocol outlined in Table 2. For the bleaching experiment, we chose four samples (CHLEA-3, CHLEA-7, CHLEA-10, and CHLEA-11). Their catchments are characterised by diverse lithologies (Fig. 1a), as well as different climatic and geomorphological properties (Fig. 1b), representing the overall heterogeneity present within all catchments. An additional reason for the selection of these samples was the higher yield of luminescent grains (Table 3); thus, measuring a few discs would provide a robust dataset for the bleaching experiment. Single-grain bleaching experiments were conducted on twenty discs (including 100 grains per disc) distributed across four samples, with 5 discs from CHLEA-3, 4 discs from CHLEA-7, 6 discs from CHLEA-10, and 5 discs from CHLEA-11.
Table 2Protocol of the bleaching experiment carried out in this study.
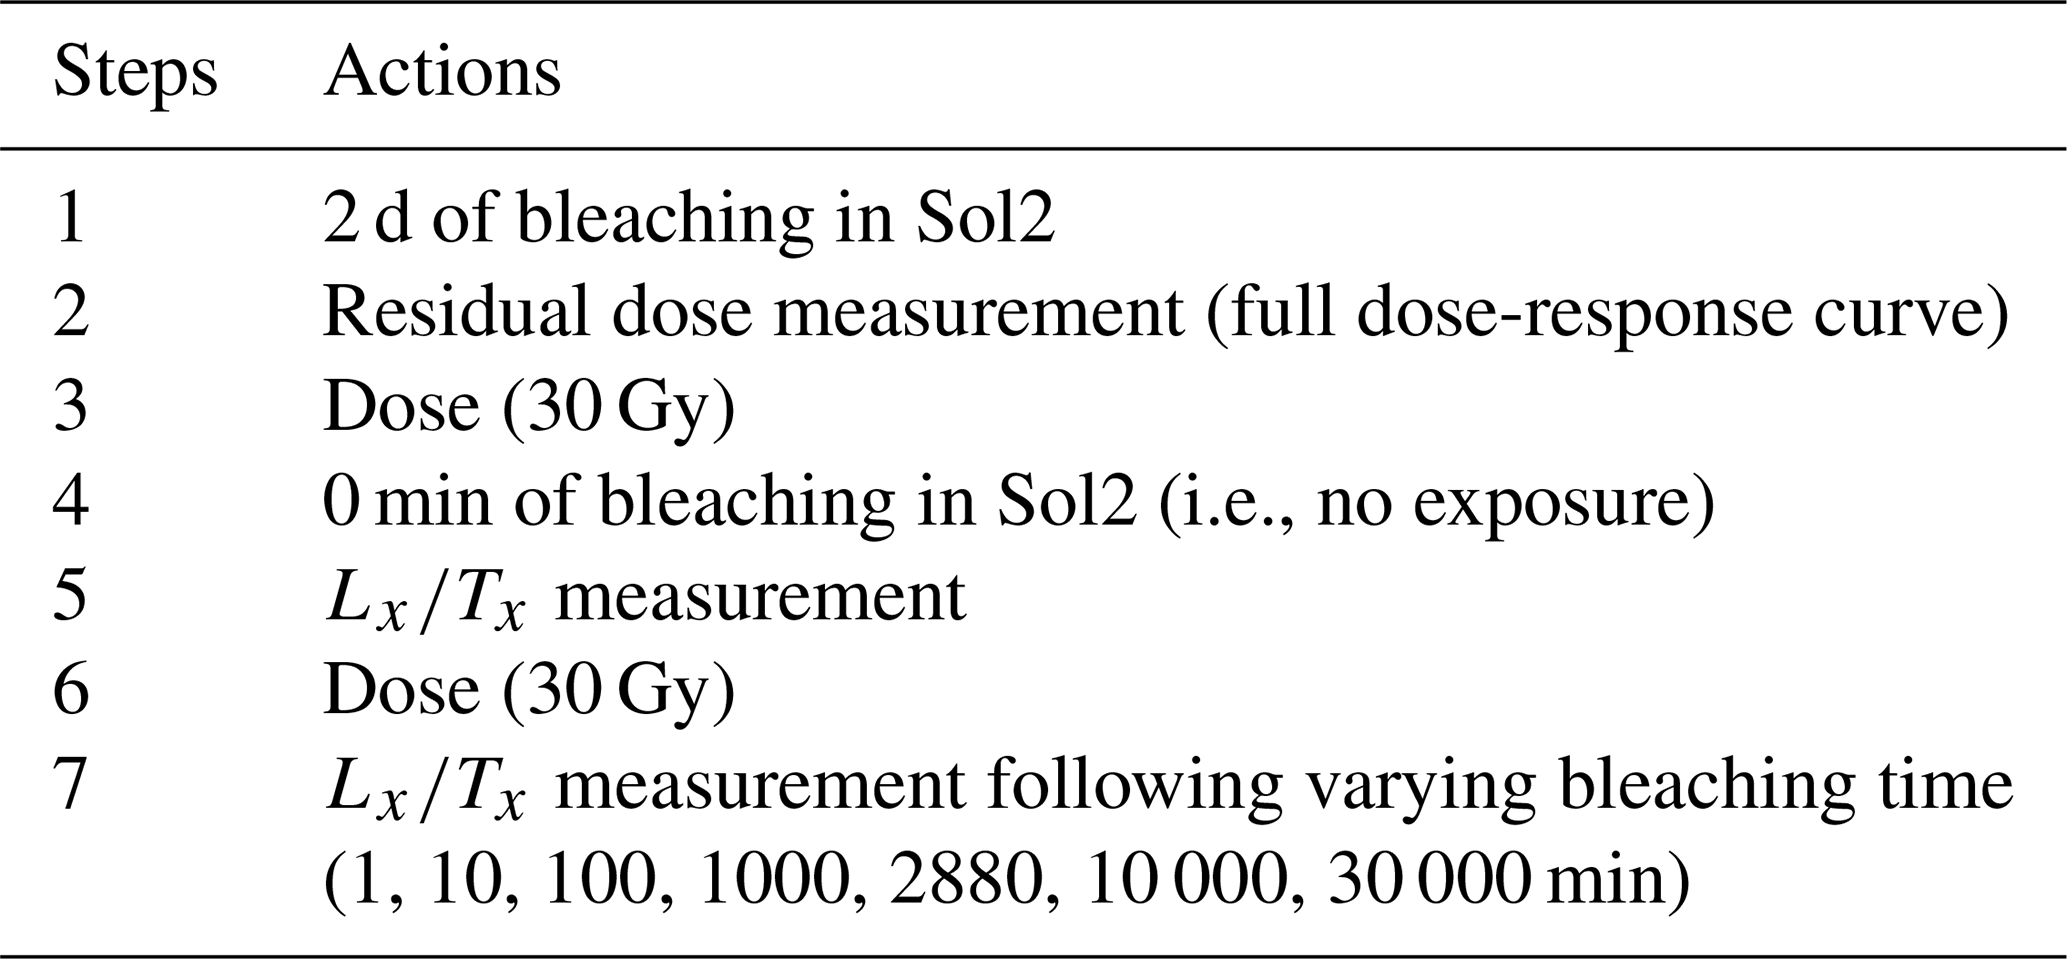
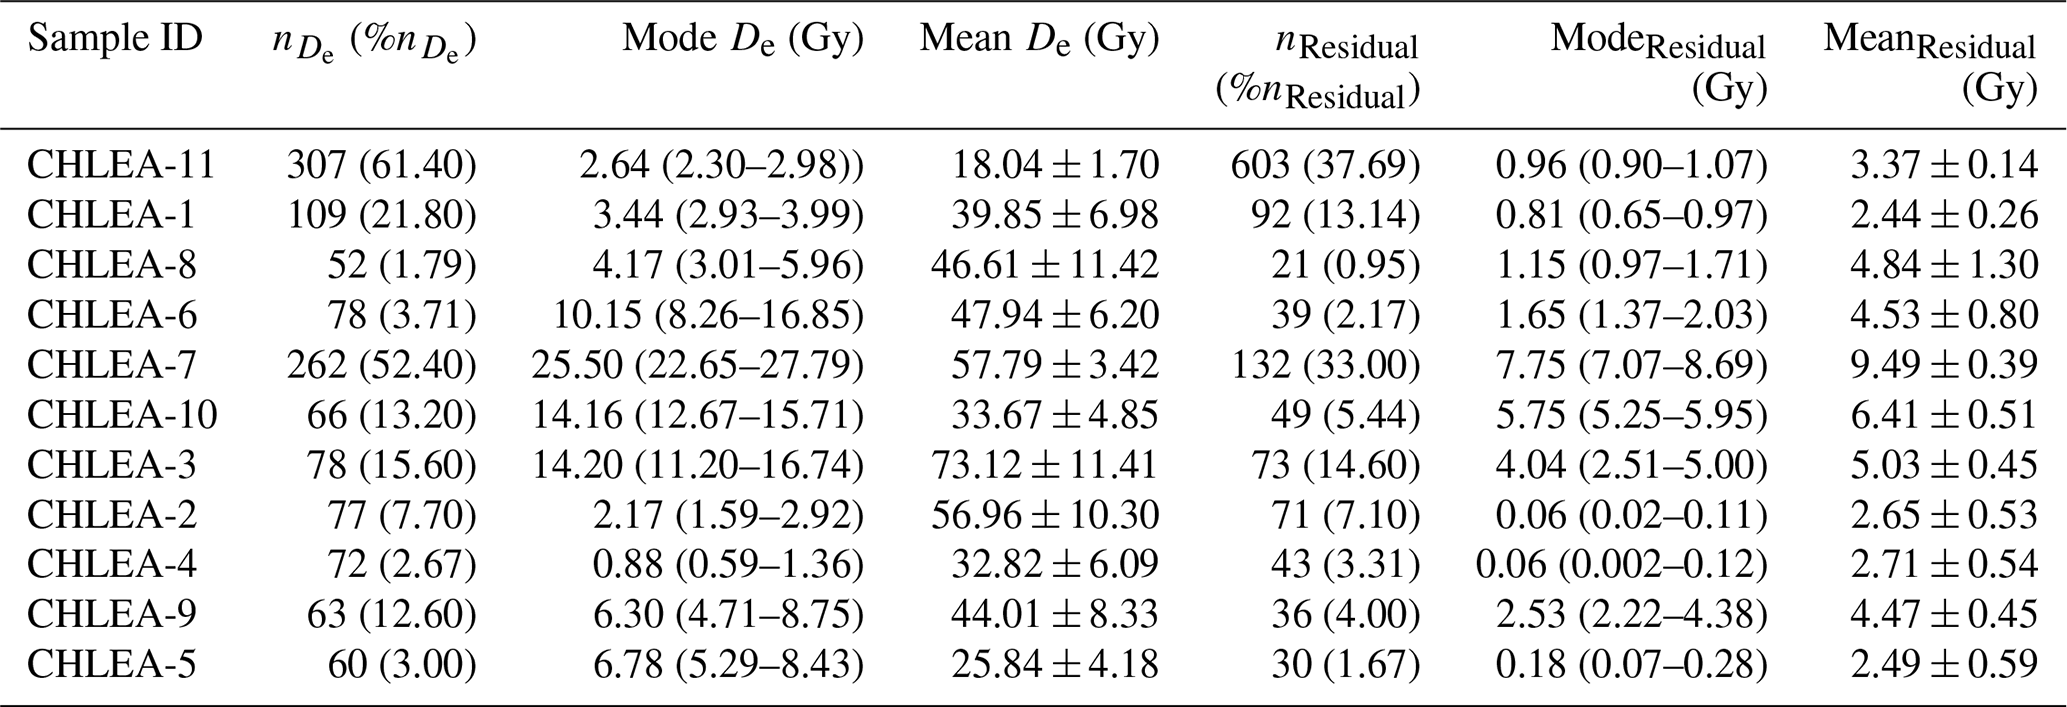
Table 3Feldspar single-grain post-IR IRSL200 results for all samples measured in this study. Columns are as follows: (%): the absolute and relative number of accepted grains used in the equivalent dose distribution; Mode De: the modal equivalent dose with 1σ confidence interval in parentheses derived from bootstrap resampling (n= 1000); Mean De: the mean equivalent dose with one standard error; nResidual (%): the absolute and relative number of accepted grains used in the residual dose distribution; ModeResidual: the modal residual dose with 1σ confidence interval in parentheses; MeanResidual: the mean residual dose with one standard error.
The experimental protocol was designed to evaluate the post-IR IRSL200 signal response of K-feldspar grains under controlled bleaching and irradiation conditions. Initially, the grains were subjected to bleaching in the Sol2 for 2 d to reset the luminescence signal, followed by the measurement of the residual dose using the protocol outlined in Table 1. After residual dose measurements, grains were selected following the acceptance criteria described in Sect. 2.3, and the residual doses of selected grains were calculated. Only these selected grains were tracked in the subsequent bleaching steps and analysed for further interpretation.
Subsequently, a beta dose of 30 Gy was administered, and the resulting signal () was recorded without exposing the grains to the solar simulator. The grains were then dosed with another 30 Gy and exposed to 1 min of bleaching before measuring the signal again. This process was repeated with varying bleaching durations ranging from 10 to 30 000 min to examine the impact of prolonged bleaching on the signal. For all steps in the bleaching experiment, a test dose of 10 Gy was applied. Repeated measurements were conducted for specific bleaching durations (10, 1000, and 2880 min) to evaluate measurement reproducibility. The ratios of all bleaching steps were normalised to the value of the no-exposure measurement (Table 2, step 5) to facilitate comparisons of signal change across bleaching steps.
2.5 Single-grain geochemistry
To measure the major element concentration of individual grains, grains from single-grain discs were embedded in epoxy and polished, following the method described in Maßon et al. (2024). Geochemical analyses were conducted on a JEOL JXA-8900RL electron microprobe at the Institute of Geology and Mineralogy of the University of Cologne. The major element composition of selected feldspar grains was determined by wavelength dispersive X-ray spectrometry with an accelerating voltage of 15 kV, a beam current of 15 nA, and a beam diameter of 3 µm. The elements Na, Al, and Si were analysed on a TAP spectrometer crystal, Fe on a LIF spectrometer crystal, K and Ca on a PET spectrometer crystal, and Ba on a LIFH spectrometer crystal. For the calibration, albite (Na, Al), quartz (Si), almandine (Fe), orthoclase (K), plagioclase (Ca), and baryte (Ba) mineral standards from an Astimex Standard Ltd. mount were used. All elements were measured for 10 s on the peak and 5 s on the background before and after the peak, except for Fe, Mn, and Ba, which were analysed for 20 s on the peak and 10 s on the background before and after the peak. The results were corrected according to the ZAF procedure from the instrument software. Orthoclase from the P&H standard block were analysed as secondary reference materials before and after each measurement session to monitor precision and accuracy (Table S7).
Electron microprobe analyses were performed on 121 grains from the four samples subjected to the bleaching experiment, with the following grain distributions: CHLEA-3 (n= 30), CHLEA-7 (n= 32), CHLEA-10 (n= 14), and CHLEA-11 (n= 45). Two-to-four-point measurements were made per grain to maximise surface coverage and improve data reliability, with the average representing the geochemical composition of the entire grain (Fig. S9). Heavily altered zones (Fig. S9c) were avoided during measurements to reduce the likelihood of errors, typically indicated by spectrally inconsistent energy-dispersive X-ray spectroscopy peaks identified through visual inspection. Detection limits for the EPMA data were calculated according to Potts (2012), and individual element concentrations were filtered out when below the detection limit (Sect. S5, Table S8). Note that geochemical data could not be obtained for every grain meeting the acceptance criteria after residual dose measurement, as some grains were lost or misplaced during transfer from the discs to the epoxy.
3.1 Equivalent and residual doses
We measured up to 2900 and up to 2200 single grains for De and residual dose determination, respectively. Following the recommendation by Rodnight (2008), we aimed to obtain at least 50 single-grain dose estimates for each sample. However, we had to limit this number to 30 for residual dose measurements due to the lack of sample material and due to the very low recovery ratio of luminescence-sensitive grains for our Andean samples. For example, sample CHLEA-8 provided grains with a very limited sensitivity, and we obtained only 21 dose estimates despite measuring 2200 grains (Table 3); thus, only ∼ 1 % of the feldspar grains provided a suitable dose estimate. A summary of acceptance and rejection statistics for single-grain De and residual dose measurements can be found in Tables S5 and S6.
Across all samples, Mode De values range from 0.88 (CI: 0.59–1.36) to 25.50 (CI: 22.65–27.79) Gy, while Mean De values range from 18.04 ± 1.70 to 73.12 ± 11.41 Gy (Table 3). Following the same approach, we characterised the residual dose distributions of each sample by extracting both the mode (ModeResidual) and mean (MeanResidual). ModeResidual values range from 0.06 (CI: 0.02–0.11) to 7.75 (CI: 7.07–8.69) Gy, and MeanResidual values range from 2.44 ± 0.26 to 9.49 ± 0.39 Gy (Table 3). Kernel density estimate plots of the single-grain De and residual dose distributions of some samples are provided in Fig. S5, with additional luminescence methods and results discussed in Sect. S3 of the Supplement.
3.2 post-IR IRSL200 laboratory bleaching behaviour
Despite lithological, geomorphological, and environmental variability at the catchment scale, all four samples investigated for their post-IR IRSL200 laboratory bleaching behaviour exhibited similar bleaching trends at the sample average level (Fig. 3a). Initially, the signal experienced a rapid reduction, followed by a more gradual decrease and eventual stabilisation. After 1 min of exposure in Sol2, the signal is reduced by ∼ 24 %. After 100 min of bleaching, ∼ 79 % of the initial signal has been depleted, and after 1000 min, only 10 % of the initial signal remains. By 2880 min (2 d), the signal reaches a rather stable level with ∼ 4 % (equivalent to 1.2 Gy) of the initial signal remaining. We also examined the bleaching trend of the IRSL50 signal (Fig. S7). However, it bleaches more rapidly than the post-IR IRSL200 signal. Notably, ∼ 95 % of the IRSL50 signal depletes after only 100 min of bleaching, and the stabilisation of signal reduction occurs between 2880 and 30 000 min, with ∼ 1 % signal remaining.
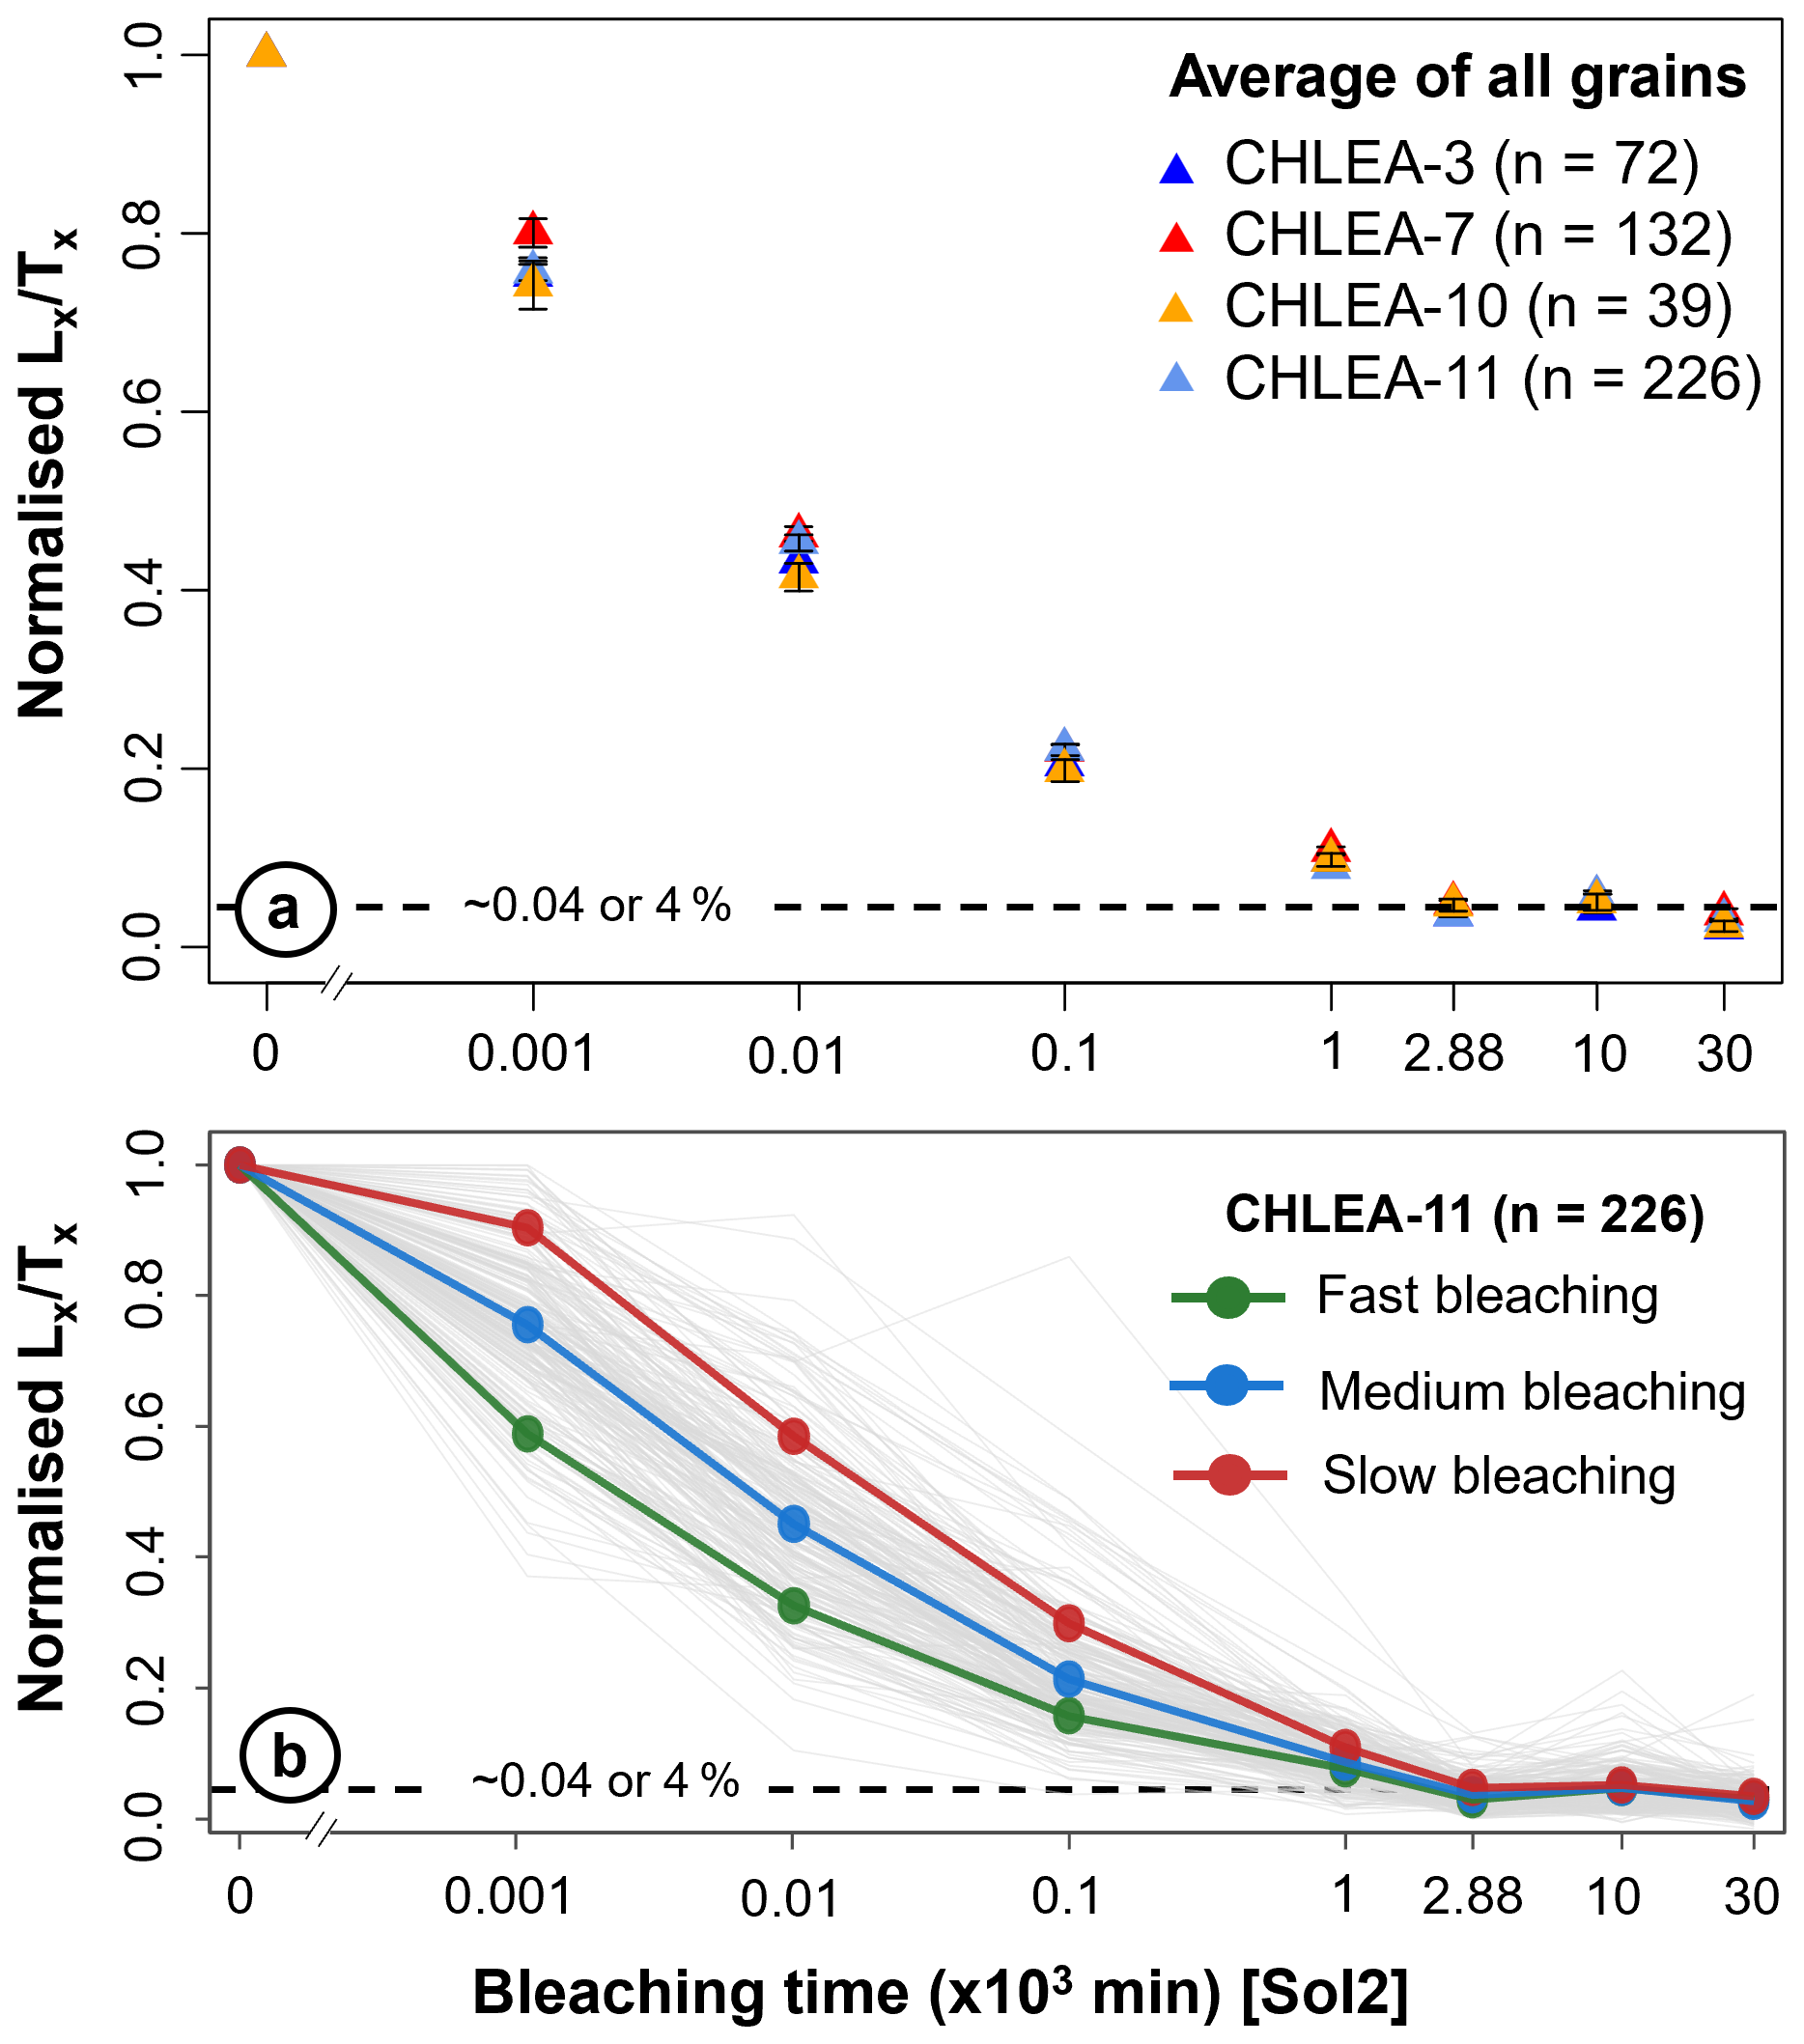
Figure 3Bleaching behaviour of the post-IR IRSL200 signal expressed as normalised luminescence signal () versus bleaching time. In panel (a), data points represent sample averages with error bars denoting one standard error. Panel (b) shows single-grain (semi-transparent grey) bleaching behaviour in response to various bleaching durations. Additionally, grains were classified into three groups based on their normalised values at the 1-minute bleaching step: lower quartile representing fast-bleaching grains (green, ≤ Q1), interquartile range representing medium-bleaching grains (blue, Q1–Q3), and upper quartile representing slow-bleaching grains (red, ≥Q3). Bold coloured lines with markers illustrate the average bleaching trajectory for each quartile group tracked consistently across all subsequent time steps. In both panels, the horizontal dashed black line marks the bleaching plateau, where approximately 4 % of the initial signal remains.
At the single-grain level, individual grains exhibited significant variation in bleaching rates (Figs. 3b, S8), each responding differently to varying light exposure duration. To quantify this bleaching variability, we classified grains from all four samples into three groups based on their normalised values at the 1 min bleaching step: fast-bleaching grains (lower quartile, ≤Q1), medium-bleaching grains (interquartile range, Q1–Q3), and slow-bleaching grains (upper quartile, ≥Q3). We then calculated the average bleaching trajectory for each quartile group and tracked these populations consistently across all subsequent bleaching steps. This quartile-based classification successfully stratified grains by their intrinsic bleaching efficiency, with all four samples showing clear separation into three distinct bleaching populations. Despite initially starting with different bleaching rates, all three populations within each sample converged toward a stable asymptotic level between 2880 and 30 000 min of bleaching, stabilising at approximately 4 % of the initial signal.
Figure 4a–d presents single-grain distributions of non-normalised values for samples CHLEA-3, CHLEA-7, CHLEA-10, and CHLEA-11 measured after different bleaching durations. As expected, individual grain signals decrease progressively with increasing bleaching time. More notably, the dispersion of these distributions narrows substantially with prolonged bleaching across all samples (Fig. 4e). The interquartile range (calculated using normalised values for more meaningful comparison) decreases from 0.16–0.18 at 1 min to 0.03–0.05 at 30 000 min, representing an approximately four-to-six-fold reduction
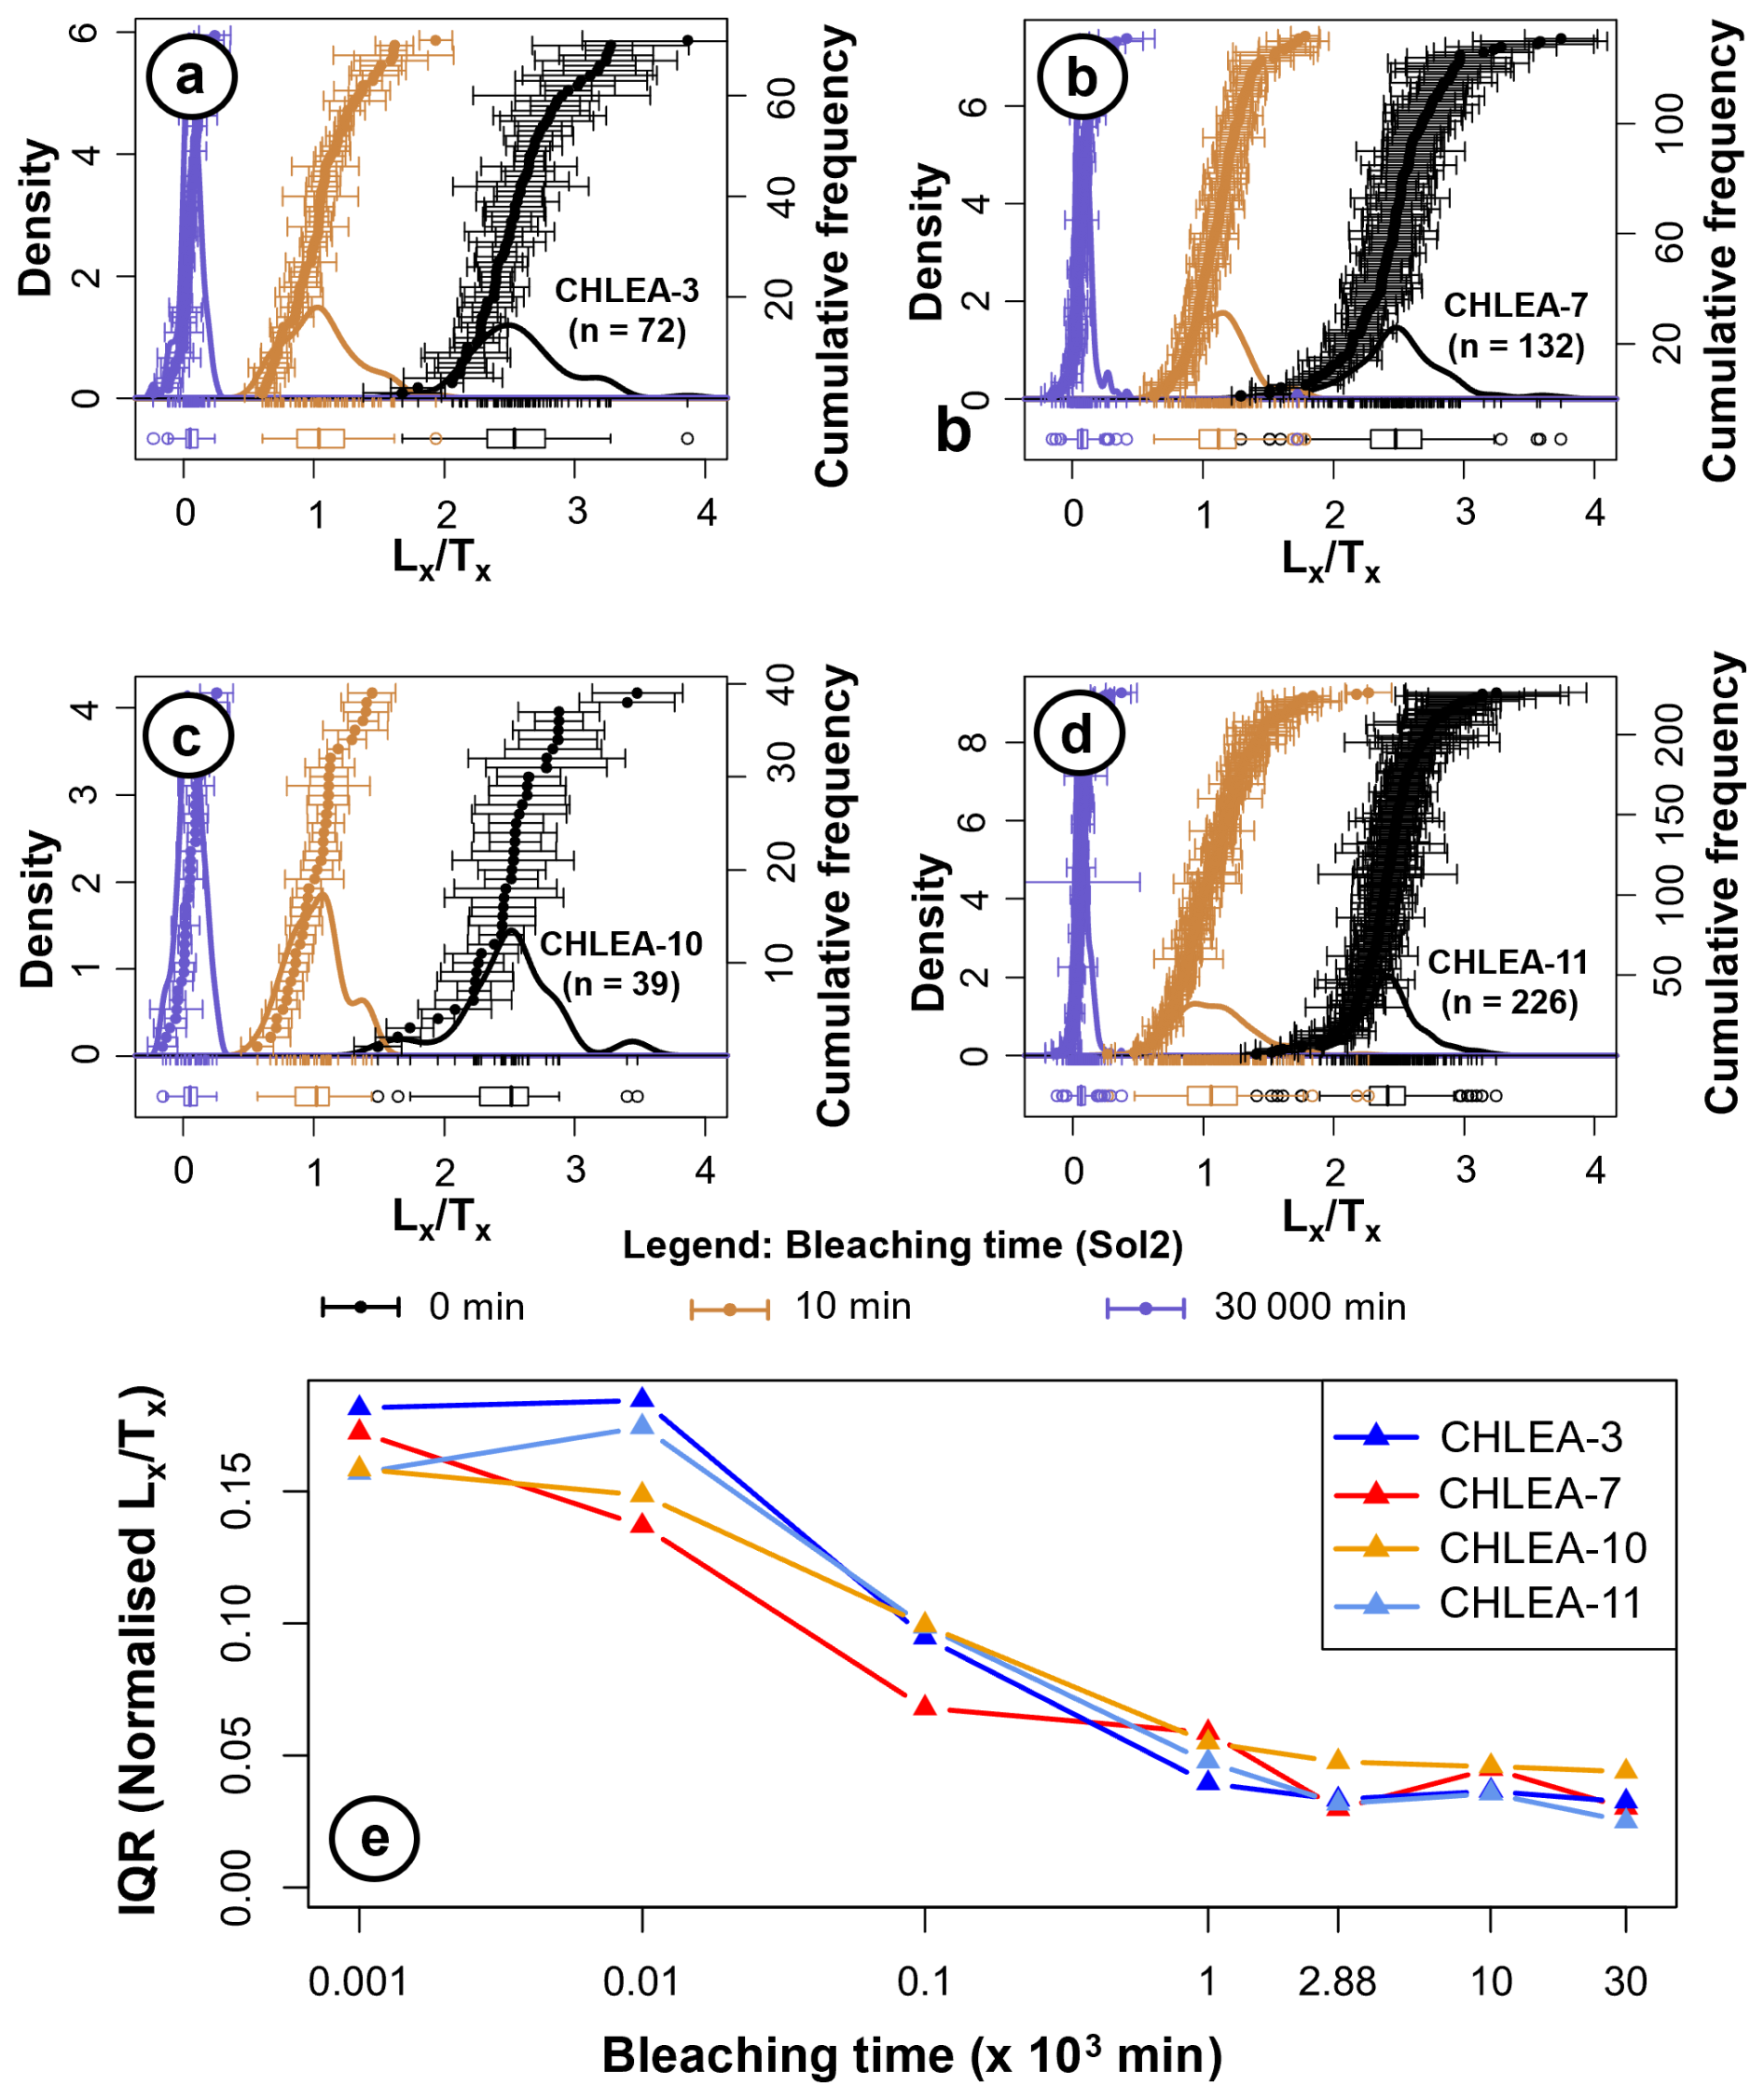
Figure 4Panels (a) to (d) show kernel density estimate (KDE) plots of non-normalised single-grain values obtained after different bleaching durations for samples CHLEA-3, CHLEA-7, CHLEA-10, and CHLEA-11. For visualisation purposes, a single datapoint with either high or high error from each sample (n= 1) has not been shown in the plots. KDE plots were generated using the default bin width nrd0 (0.9 times the minimum of the standard deviation and the interquartile range divided by 1.34 times the sample size to the negative one-fifth power, unless the quartiles coincide when a positive result will be guaranteed) of the Luminescence package in the R programming environment (Silverman, 1998). Panel (e) shows the change in interquartile range (IQR) of normalised from different bleaching durations (1 to 30 000 min) for all four samples. Note that the change in IQR depicts the successive decrease in the spread of the normalised distribution with prolonged bleaching duration in the Sol2.
3.3 Single-grain geochemical composition
The geochemical composition of single grains revealed that the K2O concentrations ranged from 0.20 wt. % to 16.60 wt. %, reflecting a broad range with a mean (±standard error) of 10.80 ± 0.32 wt. %. The average concentrations of Na2O and CaO ranged from 0.21 wt. % to 10.99 wt. % and 0 wt. % to 11.31 wt. %, respectively. The mean (±standard error) concentrations for Na2O and CaO are 3.58 ± 0.19 wt. % and 0.60 ± 0.12 wt. %, respectively. Details of microprobe measurements, including electron backscatter images of individual grains (Fig. S9), are provided in Sect. S5.
4.1 Factors influencing the bleachability of the post-IR IRSL200 signal
Our study revealed substantial variation in the magnitude of MeanResidual measured after 2 d of Sol2 bleaching, with values ranging from 2.44 ± 0.26 to 9.49 ± 0.39 Gy across all samples (Table 3). Similar variability is also apparent at the single-grain level, where residual doses (measured after 2 d of Sol2 bleaching) within individual samples range from near zero to about 23 Gy, as illustrated in Fig. 5a for the four samples included in the bleaching experiment. Given this variability, we now discuss the potential influence of bleaching duration, grain-specific geochemical composition, catchment-scale lithological variability, and natural dose on the magnitude of both residual and remnant dose to constrain the dominant factors influencing bleachability of the post-IR IRSL200 signal.
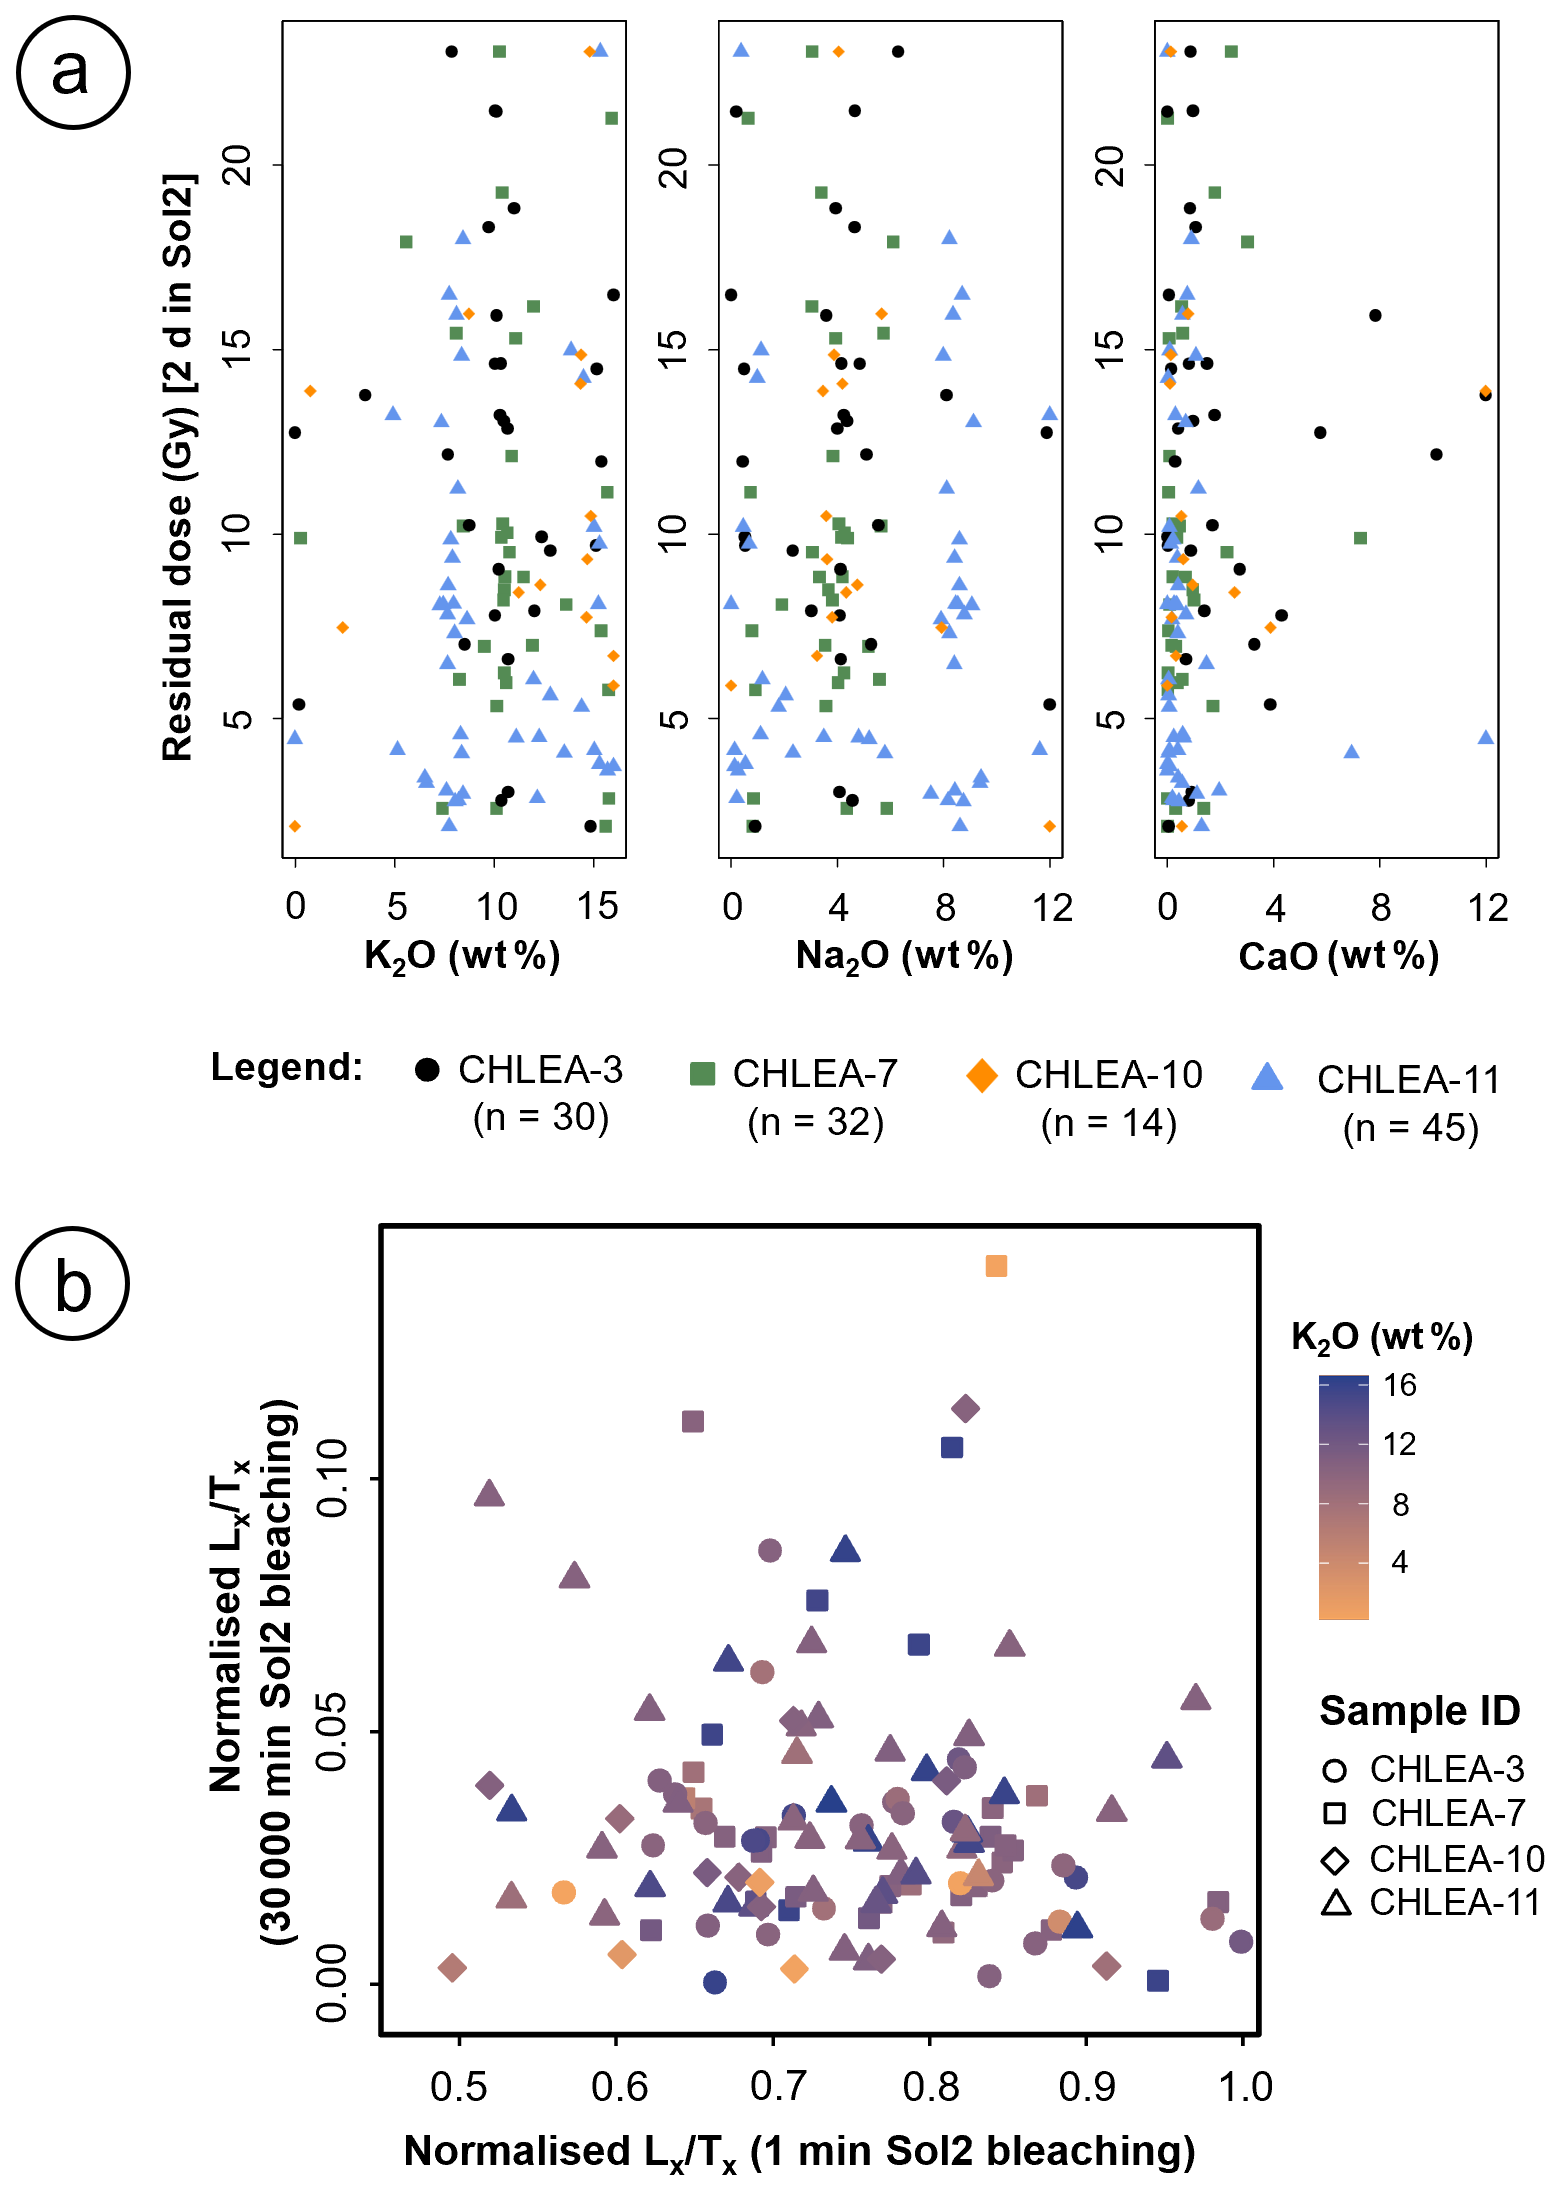
Figure 5(a) Residual dose measured after 2 d of Sol2 bleaching plotted against K2O, Na2O, and CaO concentrations of individual feldspar grains from four samples (CHLEA-3, 7, 10, 11) used in the bleaching experiment. Despite compositional variability, no systematic geochemical control on the residual dose is evident. (b) Relationship between normalised luminescence signals after 30 000 and 1 min of Sol2 bleaching. No clear correlation is observed with the initial bleaching response. Data points are colour-coded by the K2O concentration (wt. %). Uncertainties are not shown for clarity.
4.1.1 Influence of bleaching duration
On average, our laboratory bleaching experiments conducted on four samples revealed similar post-IR IRSL200 signal bleaching behaviour (Fig. 3a), despite their origin from spatially distributed catchments with diverse lithological, geomorphological, and environmental settings. A bleaching plateau based on the normalised data was reached after 2880 min (2 d) of Sol2 exposure (Fig. 3a).
At the single-grain level, bleaching rates varied substantially among grains (Figs. 3b, S8), each responding differently to the duration of light exposure. This finding is consistent with those of Smedley et al. (2015) and Choi et al. (2024). Notably, we showed that despite initial different bleaching rates, all three populations (fast, medium, and slow) of grains within each sample converged toward a similar level of normalised value by 2880 to 30 000 min. This asymptotic convergence represents a fundamental limit in signal reduction rather than insufficient bleaching duration, suggesting that differences in bleaching rates alone cannot explain the observed dispersion in absolute single-grain residual dose estimates. Furthermore, Fig. 4 demonstrates that prolonged bleaching drives the grain population toward increasingly uniform remaining signal levels (non-normalised ; Fig. 4a–d). This homogenisation is reflected in a four-to-six-fold reduction in the interquartile range of normalised values (Fig. 4e), indicating that initial bleaching rate variability diminishes with extended light exposure.
These findings reveal a dual role for bleaching duration: while it fundamentally controls residual dose magnitude until the plateau is reached (based on normalised ), it cannot account for the variability observed in single-grain residual dose estimates measured after 2 d of Sol2 bleaching. However, prolonged exposure proves crucial for dose homogenisation, demonstrating its effectiveness in minimising grain-to-grain variability in the post-IR IRSL200 signal and reducing the spread of residual dose estimates within each sample.
4.1.2 Influence of geochemical composition
To evaluate whether variations in the bleaching extent of individual grains are influenced by their geochemical composition, we examined the relationship of grain-specific average major oxide concentrations (K2O, Na2O, and CaO) with corresponding residual doses (Fig. 5a). Moreover, we analysed the relationship between K2O concentration and normalised values after 1 and 30 000 min of bleaching (Fig. 5b) to assess the potential role of geochemistry and especially the K-concentration of the feldspars in controlling bleaching rates. We also extended the analysis to include comparisons with other oxide concentrations (Fe2O3, BaO, SiO2, Al2O3) and normalised values after 1, 1000, and 30 000 min of Sol2 bleaching durations. A correlation matrix for the entire dataset (Fig. S10) revealed no statistically significant correlation (p-value > 0.05) between major oxide concentrations (wt. %), normalised values, and residual doses, except for a few cases showing very weak correlations, with correlation coefficient (r) ranging between −0.19 and 0.22. (Normalised of 1 min vs. Al2O3, ; normalised of 1000 min vs. Na2O, r= −0.20; normalised of 1000 min vs. K2O, r= 0.22; residual dose vs. SiO2, ; residual dose vs. CaO, r= 0.19). These comparisons suggest that neither the extent of bleaching nor the rate at which individual grains bleach is influenced by their geochemical composition.
4.1.3 Influence of catchment-scale lithological variability
All four samples included in the bleaching experiment exhibited similar bleaching behaviour (Fig. 3a), despite notable variability in catchment-scale lithological composition (Table S1). We examined whether a provenance relationship exists between the distribution of lithological units, Mode De, and the ModeResidual estimates across all catchments (Fig. S12). The results suggest that neither the Mode De nor the ModeResidual estimates are directly influenced by catchment lithology. Furthermore, we evaluated whether the dominant lithological unit (i.e., the unit with the highest proportion) exerts any control on the size of the Mode De and ModeResidual estimates. No consistent correlation was observed between the dominant lithological unit, Mode De, and ModeResidual estimates (Fig. S12). For example, CHLEA-4 and CHLEA-7 originate from catchments with similar dominant lithologies (Table S1), yet both their Mode De and ModeResidual estimates differ markedly (Table 3, Fig. S5a, c), while CHLEA-6 and CHLEA-9 exhibit comparable Mode De and ModeResidual estimates (Table 3, Fig. S5b, d) despite different dominant lithologies (Table S1). These observations align with grain-specific residual dose variability and associated geochemical compositions (Fig. 5a). Collectively, these findings suggest that the bleaching behaviour of the post-IR IRSL200 signal is not directly controlled by catchment-scale lithological variability. However, such external factors may influence the bleaching opportunities (i.e., exposure duration in natural settings), contributing to variability in natural De distributions.
4.1.4 Influence of natural dose (i.e., comparing laboratory bleaching with natural bleaching of modern analogues)
Sohbati et al. (2012), Buylaert et al. (2012), Kars et al. (2014), and Yi et al. (2016) compared the size of the natural De with the size of measured residual doses and observed a positive correlation between these two variables, with the size of the residual doses increasing with increasing De. Following these findings, for all of our modern analogues, we compared the MeanResidual with their corresponding Mean De. In contrast to previous studies, we found only a weak positive linear correlation (R2= 0.16; Fig. S6) between mean residual dose and mean De. However, our samples are derived from modern floodplains with fluvial transport potentially leading to heterogeneous bleaching of the luminescence signal (Guyez et al., 2023). To account for this, we compared Mode De with ModeResidual estimates measured after 2 d of Sol2 bleaching.
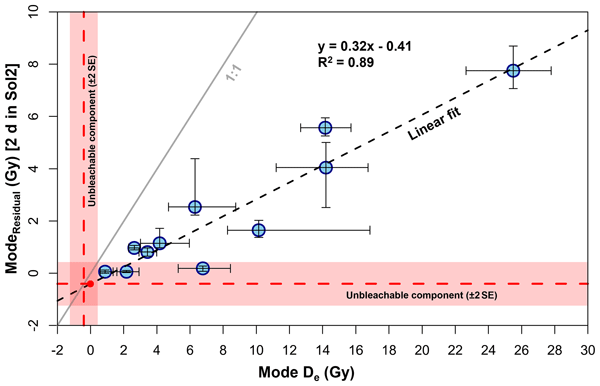
The corresponding relationship between the Mode De and the ModeResidual estimates reveals a statistically robust positive correlation (R2= 0.89, Fig. 6). This could be interpreted as evidence that incomplete bleaching is inherently dose-dependent, that is, grains carrying a larger accumulated dose are progressively harder to bleach. This result demonstrates that the magnitude of residual dose, as quantified through laboratory bleaching, is primarily controlled by the natural dose of the best-bleached grain population under natural conditions. This relationship provides a mechanistic explanation for the substantial residual dose variability observed at the single-grain level. It is also worth noting that the intercept of the linear fit (−0.41 ± 0.84 Gy) is indistinguishable from zero within uncertainty. This intercept was interpreted in earlier studies as the unbleachable component (Sohbati et al., 2012; Buylaert et al., 2012; Kars et al., 2014; Yi et al., 2016), with values reported at 0.93 ± 0.80 Gy for a comparable post-IR IRSL225 protocol (Sohbati et al., 2012). Its negligible value in our modern analogues suggests that the truly irreducible dose component plays no significant role in our samples.
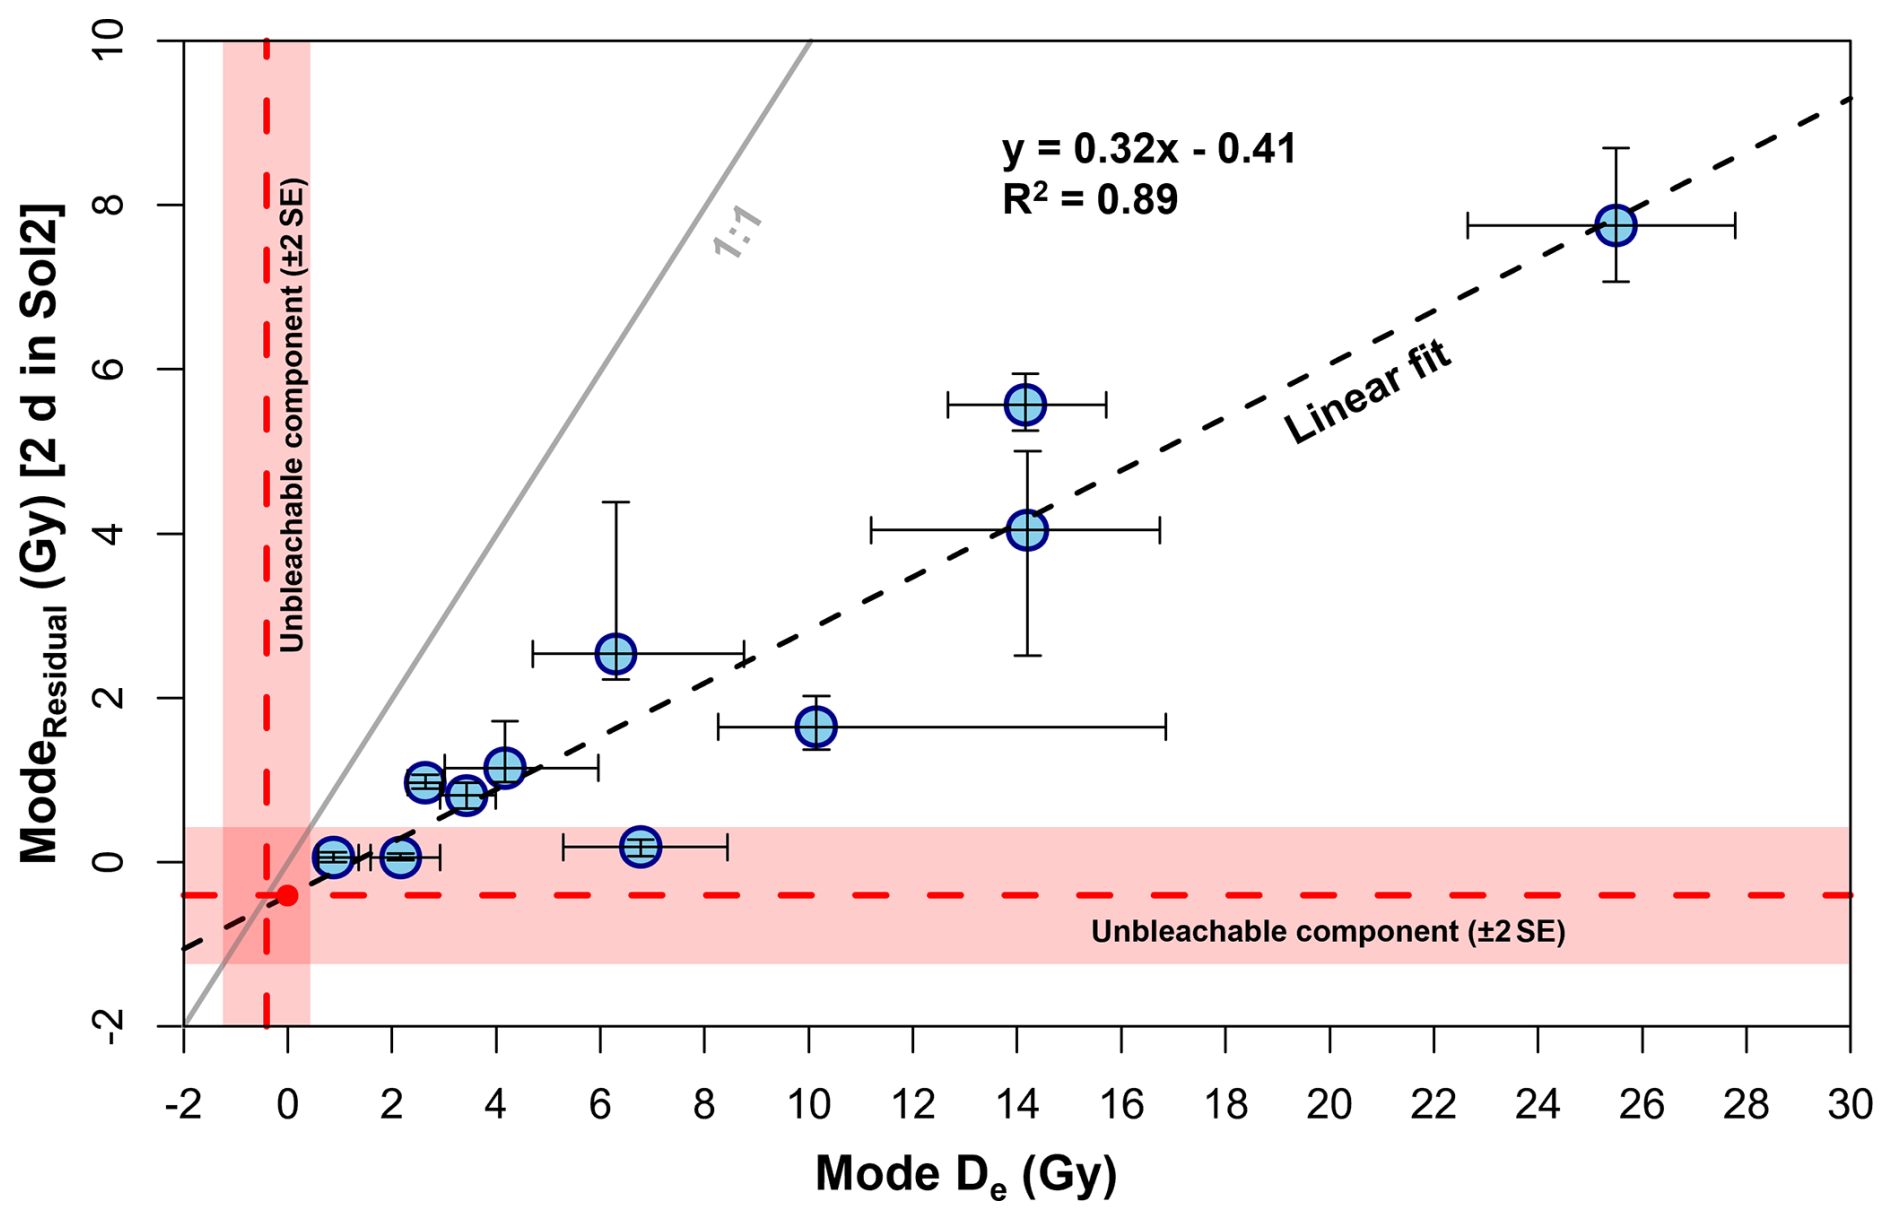
Figure 6Relationship between the modal equivalent dose (Mode De) and the modal residual dose (ModeResidual) following 2 d of Sol2 bleaching for all samples measured in this study. Error bars represent 1σ confidence intervals derived from bootstrap resampling (n= 1000). The dashed black line represents a linear fit to the data. The solid grey line represents the 1:1 relationship, above which ModeResidual would exceed the Mode De. The horizontal dashed red line, together with the shaded red band, denotes the estimated unbleachable component (±2 standard errors). A corresponding vertical red dashed line and shaded band on the x-axis denote the same unbleachable component in terms of Mode De, facilitating visual comparison and emphasising the systematic overestimation of Mode De relative to the unbleachable component.
To further investigate the observed natural dose-dependent bleaching efficiency, we conducted additional laboratory bleaching experiments on CHLEA-7 and CHLEA-11 (section S6 of the supplementary material). For each sample, doses of 30, 60, and 120 Gy were added to their respective natural doses, followed by two-days of bleaching period in the Sol2 (Table S9). Subsequent measurements of residual dose (both mean and mode) revealed contrasting behaviours between the two samples (Fig. S11; Table S10). CHLEA-7 exhibited no discernible dose-dependent trend, whereas CHLEA-11 showed a weak but noticeable increase in residual dose with increasing laboratory dose. Together with the results shown in Fig. 6, these observations indicate that bleaching efficiency may be inversely related to the natural dose level, with samples of lower natural dose exhibiting inherently more effective bleaching under laboratory conditions. The underlying mechanisms responsible for this phenomenon remain unclear. Further investigations, potentially focusing on trap characteristics, are warranted to elucidate the processes involved. However, such exploration lies beyond the scope of the present study.
4.2 Assessment of recuperation dose as a proxy for bleachability
Based on the observations of Choi et al. (2024), who reported a positive linear relation between recuperation dose and residual dose, and proposed the former as a potential proxy for evaluating bleachability, we examined the relationship between absolute recuperation dose and residual dose at both single-grain and sample-average levels across all samples (Sect. S8). At the single-grain level, the majority of samples showed statistically significant positive relationships (Fig. S13a, Table S11); however, the proportion of variance in residual dose explained by recuperation dose, as quantified by the coefficient of determination (R2), was consistently low (Table S11). Likewise, at the sample-average level, a weak positive linear trend (Fig. S13b) was observed (R2= 0.27), though the association did not reach statistical significance (p>0.05). These findings suggest that, despite the presence of positive trends for the majority of the samples, the recuperation dose accounts for only a small fraction of the variability in residual dose, and therefore may not serve as a robust standalone proxy for bleachability.
4.3 Implications for dating and sediment tracing applications
4.3.1 Dating sedimentary archives
Previous studies, including Reimann et al. (2011), Reimann and Tsukamoto (2012), and Fu and Li (2013), have subtracted laboratory-determined residual doses from paleodoses when dating K-feldspar fractions of young sedimentary deposits. While a small residual component (< 2 Gy) might have minimal influence on the age estimates of older deposits, it may significantly impact the dose estimates of young deposits. Consequently, the validity of this approach has been questioned, particularly due to uncertainties in whether artificial bleaching replicates natural bleaching processes (Kars et al., 2014).
Thus, to improve age accuracy, Ollerhead and Huntley (2011) and Kars et al. (2014) have proposed to subtract remnant doses of modern analogues from calculated palaeodoses. However, substantial uncertainties remain due to limited knowledge of the bleaching conditions, such as the transport medium, duration of transport, and number of depositional cycles. In our investigation of modern fluvial analogues, we addressed this challenge by using single-grain analysis and isolating only the best-bleached grain population. We adopted the Mode De values as proxies for remnant doses and compared them to laboratory-determined ModeResidual doses obtained after 2 d of bleaching in Sol2 (Fig. 6).
Our results reveal a strong positive correlation between the Mode De values and laboratory ModeResidual doses (Fig. 6), indicating a systematic relationship between natural and laboratory bleaching processes. The position of data points below the 1:1 line confirms that, while a residual dose is present in all samples, it does not fully account for the measured remnant dose. Thus, further supporting the inappropriateness of using residual dose for correcting palaeodoses. Importantly, we also observe that even the Mode De values of our modern analogues systematically overestimate the unbleachable component (which is indistinguishable from zero within uncertainty, see Fig. 6). The Mode De values of our best bleached modern analogues overestimate the unbleachable component by ∼ 1 to 4 Gy whereas the Mode De values of the poorest bleached sample overestimate the unbleachable component by more than 20 Gy (see Fig. 6). This indicates that even the best-bleached grain population isolated via the mode of the dose distribution retains significant inherited dose contributions. Notably, we observe a large variation in remnant doses (i.e., Mode De) of the modern analogues. Therefore, subtracting the remnant dose of a single (random) modern analogue is not a reliable method for correcting palaeodoses from sedimentary archives. Instead, we evaluate three options for addressing this issue, each with its own advantages and limitations.
-
Not correcting the palaeodose for the size of the remnant dose.
-
Advantage: Jain et al. (2004) argued that modern analogues possess undefined preservation potential and therefore cannot be reliably compared to geological archives, which are preserved due to their inherently higher preservation potential. Furthermore, although all our samples were collected from a modern floodplain environment, the data exhibit considerable variability in remnant dose magnitudes, ranging from 0.88 to 25.50 Gy (Table 3, Fig. 6). This pronounced scatter supports the rationale for avoiding any corrective measures.
-
Limitation: While not correcting palaeodoses for the size of a potential remnant dose may be preferred in light of the scatter observed for remnant doses of the modern analogues in the present study, it risks significant age overestimation in samples where remnant doses are particularly high. Additionally, the risk of significant age overestimation is particularly important for young samples.
-
-
Using the remnant doses for palaeodose correction.
-
Advantage: In our dataset, all eleven modern analogue remnant doses (calculated as the mode of the natural De distribution) are substantially higher than both the laboratory residual doses and the unbleachable component (Fig. 6). This consistent disparity, coupled with the pronounced scatter in remnant dose values across samples, underscores the limitations of applying individual remnant doses directly for palaeodose correction. Instead, one could propose estimating the remnant dose and its associated uncertainty based on the observed variability within a set of modern analogues. A comparable approach was applied in Joordens et al. (2015), where they used the average remnant dose and a large uncertainty based on available literature values encompassing a broad range of remnant doses from well-bleached aeolian deposits to heterogeneously bleached glacial outwash deposits for dating of fluvial samples from Java (Indonesia) using the pIRIR290 protocol.
-
Limitation: Although this approach may be suitable for dating older sedimentary archives, where any inaccuracy in remnant dose estimation represents a relatively small proportion of the total palaeodose (Joordens et al., 2015), it carries a greater risk for younger deposits, where the same absolute uncertainty in the remnant dose estimate would have a proportionally larger impact on dating accuracy. The reliability of this approach strongly depends on the match of available modern analogue-based remnant doses and the set of samples to be dated in terms of bleaching behaviour, statistical treatment of the data, and bleaching opportunities.
-
-
Using the unbleachable component for palaeodose correction.
-
Although based on our observation, the unbleachable component is indistinguishable from zero within uncertainty, accounting for the upper bound of its uncertainty yields a value of 0.43 Gy. An unbleachable component of this magnitude becomes particularly significant when dating samples representing a decade or century-old event. For this reason, it is important to consider both the potential advantages and limitations of using the unbleachable component as a basis for palaeodose correction.
-
Advantage: This method involves using the lowest dose level that cannot be further reduced through bleaching, the unbleachable component (Fig. 6), as a correction factor. This component is reproducible with high confidence and carries minimal risk of overcorrection, making it a stable and quantifiable basis for palaeodose correction.
-
Limitation: This unbleachable component is significantly lower than the remnant doses in our modern analogues, even after applying the mode to represent the best bleached dose component from single-grain data. Thus, given the scatter in remnant dose of our data (Fig. 6), use of the unbleachable component would introduce a one-directional systematic error, as this would systematically undercorrect the true inherited dose (Fig. 6). Based on our data, in optimal scenarios, this undercorrection could amount to approximately 0.5 to 4 Gy; however, in less favourable cases, the discrepancy may exceed ∼ 20 Gy.
-
Suggestions
For aeolian and coastal deposits, where bleaching tends to be more complete and homogeneous, resulting in minimal dose scatter, the use of the unbleachable component may be appropriate. However, for fluvial and glacio-fluvial settings, characterised by heterogeneous bleaching and high dose scatter, the approach based on modern analogues may be more effective. However, an average remnant dose may not adequately represent the full inter-sample variability of modern analogues. Instead, using other statistical parameters based on a distribution of remnant doses of multiple modern analogues (such as the mode or median) could potentially yield more representative and meaningful corrections. Moreover, it is important to recognise that any correction approach is inherently linked to the protocol used for De estimation, aliquot size (e.g., multi-grain vs. single-grain), and selection of the statistical age model for dose estimation (e.g., CAM, MAM). Also, future work should focus on evaluating modern analogues across diverse depositional environments to determine whether correction strategies need to be tailored to specific settings.
4.3.2 Sediment tracing
Bleaching is a fundamental aspect of luminescence-based sediment tracing method. Previous research has demonstrated that various geomorphic and environmental factors influence the bleaching opportunities of individual grains originating from different geomorphic settings (Gemmell, 1985; King et al., 2013, 2014; MacGuire and Rhodes, 2015; Chamberlain et al., 2017; Gray et al., 2018; Guyez et al., 2023). Therefore, a critical step in applying luminescence as a sediment tracer involves identifying grain populations according to their bleaching history, notably the well-bleached grains. This requires the development of a reliable threshold, which is sensitive to a given geomorphic setting, to confidently distinguish well-bleached from partially bleached grains.
For instance, Guyez et al. (2023) employed the proportion of well-bleached versus non-bleached grains for tracing sediment pathways in New Zealand, using a threshold of 10 Gy for defining well-bleached grains based on residual dose measurements after 65 h of bleaching in Sol2. While practical, this approach may oversimplify site-specific variability in bleaching. A more refined approach would involve characterising the bleaching efficiency for a subset of samples through controlled laboratory or natural bleaching experiments to establish a more precise bleaching threshold. For our modern fluvial samples, a more sample-specific method would be to classify grains as well-bleached if their natural De falls within the 2σ range around the mean of the single-grain residual dose distribution of each sample, provided a clear bleaching plateau is reached. This approach, though time-intensive, appears more appropriate and realistic, as it provides a sample-specific bleaching threshold. Although further testing is required to validate this method in sediment tracing studies, similar to the approach used by Guyez et al. (2023), these findings lay the groundwork for implementing more refined sediment tracing models that better account for grain-scale luminescence signal variability.
We examined the bleaching behaviour of the post-IR IRSL200 signal in modern fluvial samples from the Southern Central Andes through controlled laboratory bleaching experiments at the single-grain level. The samples, sourced from catchments characterised by varying lithology, climate, and slope, were exposed to varying durations of light. Despite catchment-scale variations, all samples exhibited similar bleaching trends at the sample-average level, reaching a bleaching plateau based on the normalised data, after 2 d of exposure. At the single-grain level, however, bleaching rates and extents varied across exposure durations, indicating that while the bleaching duration fundamentally controls the magnitude of the residual dose, it does not account for the observed variability in single-grain residual dose estimates. Grain-specific luminescence and geochemical analysis showed that the variations in bleaching rates and corresponding residual doses are not linked to the geochemical composition (including the K-concentration) of individual feldspar grains. Instead, residual dose (ModeResidual) variability correlated with the size of the natural doses (Mode De), identifying natural doses as likely controlling the observed variability in residual dose estimates both within and among samples. Given the systematic overestimation of remnant doses of modern analogues relative to both the residual doses and the unbleachable component and substantial variation in remnant doses across our dataset, we evaluate different possibilities of palaeodose correction and make suggestions for corrections, accounting for the depositional environment, and more importantly, for the measurement protocol, aliquot size, and statistical age model. Additionally, sample-specific residual doses may aid in establishing effective bleaching thresholds to distinguish well-bleached from partially bleached grains, a key requirement in luminescence-based sediment tracing studies.
The single-grain geochemical data used in this study are available on Zenodo at https://doi.org/10.5281/zenodo.19971385 (Biswas et al., 2026).
The supplement related to this article is available online at https://doi.org/10.5194/gchron-8-297-2026-supplement.
AB: methodology, investigation, data analysis, visualisation, writing – original draft; SR: conceptualisation, methodology, writing – review and editing; LKB: sample collection, writing – review and editing; MH: investigation, writing – review and editing; AG: sample collection, writing – review and editing; SB: funding acquisition, project management, sample collection, writing – review and editing; TR: conceptualisation, funding acquisition, project management, writing – review and editing.
The contact author has declared that none of the authors has any competing interests.
Publisher's note: Copernicus Publications remains neutral with regard to jurisdictional claims made in the text, published maps, institutional affiliations, or any other geographical representation in this paper. The authors bear the ultimate responsibility for providing appropriate place names. Views expressed in the text are those of the authors and do not necessarily reflect the views of the publisher.
We thank all members of the Cologne Luminescence Laboratory, especially Dominik Brill and Anja Zander, for their support during the bleaching experiment. We also thank Kathrin Jung for preparing the epoxy pucks for electron microprobe analysis and Tom Kühle for his assistance during the microprobe measurements. We thank Jakob Wallinga and an anonymous reviewer for their constructive feedback, which helped us to improve the manuscript.
This research is part of the joint collaborative project “WEARING DOWN – the continental weathering-erosion-transport-deposition nexus in a new light”. This research has been supported by the Deutsche Forschungsgemeinschaft (grant no. 490899032 (RE3580/2-1)) and the Agence Nationale de la Recherche (grant no. ANR-21-CE01-0020).
This open-access publication was funded by Universität zu Köln.
This paper was edited by Sumiko Tsukamoto and reviewed by Jakob Wallinga and one anonymous referee.
Aceituno, P., Boisier, J. P., Garreaud, R., Rondanelli, R., Rutllant, J. A.: Climate and Weather in Chile, in: Fernández, B., Gironás, J. (eds) Water Resources of Chile, World Water Resources, vol. 8, Springer, Cham. https://doi.org/10.1007/978-3-030-56901-3_2, 2021.
Alexanderson, H. and Murray, A. S.: Luminescence signals from modern sediments in a glaciated bay, NW Svalbard, Quat. Geochronol., 10, 250–256, https://doi.org/10.1016/j.quageo.2012.01.001, 2012.
Bateman, M. D.: Luminescence dating of periglacial sediments and structures, Boreas, 37, 574–588, https://doi.org/10.1111/j.1502-3885.2008.00050.x, 2008.
Biswas, A., Riedesel, S., Karman-Besson, L., Hellers, M., Guyez, A., Bonnet, S., and Reimann, T.: Novel insights into the post-IR IRSL200 signal bleachability of single-grain K-feldspars in fluvial modern analogues from the Southern Central Andes, Chile, Zenodo [data set], https://doi.org/10.5281/zenodo.19971385, 2026.
Bonnet, S., Reimann, T., Wallinga, J., Lague, D., Davy, P., and Lacoste, A.: Landscape dynamics revealed by luminescence signals of feldspars from fluvial terraces, Sci. Rep., 9, 8569, https://doi.org/10.1038/s41598-019-44533-4, 2019.
Bøtter-Jensen, L., Andersen, C. E., Duller, G. A., and Murray, A. S.: Developments in radiation, stimulation and observation facilities in luminescence measurements, Radiat. Meas., 37, 535–541, https://doi.org/10.1016/S1350-4487(03)00020-9, 2003.
Brill, D., Reimann, T., Wallinga, J., May, S. M., Engel, M., Riedesel, S., and Brückner, H.: Testing the accuracy of feldspar single grains to date late Holocene cyclone and tsunami deposits, Quat. Geochronol., 48, 91–103, https://doi.org/10.1016/j.quageo.2018.09.001, 2018.
Buylaert, J. P., Murray, A. S., Thomsen, K. J., and Jain, M.: Testing the potential of an elevated temperature IRSL signal from K-feldspar, Radiat. Meas., 44, 560–565, https://doi.org/10.1016/j.radmeas.2009.02.007, 2009.
Buylaert, J. P., Jain, M., Murray, A. S., Thomsen, K. J., Thiel, C., and Sohbati, R.: A robust feldspar luminescence dating method for Middle and Late Pleistocene sediments, Boreas, 41, 435–451, https://doi.org/10.1111/j.1502-3885.2012.00248.x, 2012.
Buylaert, J. P., Újvári, G., Murray, A. S., Smedley, R. K., and Kook, M.: On the relationship between K concentration, grain size and dose in feldspar, Radiat. Meas., 120, 181–187, https://doi.org/10.1016/j.radmeas.2018.06.003, 2018.
Chamberlain, E. L. and Wallinga, J.: Seeking enlightenment of fluvial sediment pathways by optically stimulated luminescence signal bleaching of river sediments and deltaic deposits, Earth Surf. Dynam., 7, 723–736, https://doi.org/10.5194/esurf-7-723-2019, 2019.
Chamberlain, E. L., Wallinga, J., Reimann, T., Goodbred Jr, S. L., Steckler, M. S., Shen, Z., and Sincavage, R.: Luminescence dating of delta sediments: Novel approaches explored for the Ganges-Brahmaputra-Meghna Delta, Quat. Geochronol., 41, 97–111, https://doi.org/10.1016/j.quageo.2017.06.006, 2017.
Choi, J., Chamberlain, E., and Wallinga, J.: Variance in pIRIR signal bleaching for single grains of feldspar, Quat. Geochronol., 83, 101577, https://doi.org/10.1016/j.quageo.2024.101577, 2024.
de Boer, A.-M., Schwanghart, W., Mey, J., Adhikari, B. R., and Reimann, T.: Insight into the dynamics of a long-runout mass movement using single-grain feldspar luminescence in the Pokhara Valley, Nepal, Geochronology, 6, 53–70, https://doi.org/10.5194/gchron-6-53-2024, 2024.
Duller, G. A.: Single-grain optical dating of Quaternary sediments: why aliquot size matters in luminescence dating, Boreas, 37, 589–612, https://doi.org/10.1111/j.1502-3885.2008.00051.x, 2008.
Fu, X. and Li, S. H.: A modified multi-elevated-temperature post-IR IRSL protocol for dating Holocene sediments using K-feldspar, Quat. Geochronol., 17, 44–54, https://doi.org/10.1016/j.quageo.2013.02.004, 2013.
Garreaud, R. D., Vuille, M., Compagnucci, R., and Marengo, J.: Present-day South American climate, Palaeogeogr. Palaeocl., 281, 180–195, https://doi.org/10.1016/j.palaeo.2007.10.032, 2009.
Gemmell, A. M. D.: Zeroing of the TL signal of sediment undergoing fluvial transportation: a laboratory experiment, Nucl. Tracks, 10, 695–702, https://doi.org/10.1016/0735-245X(85)90077-8, 1985.
Godfrey-Smith, D. I., Huntley, D. J., and Chen, W. H.: Optical dating studies of quartz and feldspar sediment extracts, Quaternary Sci. Rev., 7, 373–380, https://doi.org/10.1016/0277-3791(88)90032-7, 1988.
Gray, H. J., Tucker, G. E., and Mahan, S. A.: Application of a luminescence-based sediment transport model, Geophys. Res. Lett., 45, 6071–6080, https://doi.org/10.1029/2018GL078210, 2018.
Guralnik, B., Li, B., Jain, M., Chen, R., Paris, R. B., Murray, A. S., Li, S. H., Pagonis, V., Valla, P. G., and Herman, F.: Radiation-induced growth and isothermal decay of infrared-stimulated luminescence from feldspar, Radiat. Meas., 81, 224–231, https://doi.org/10.1016/j.radmeas.2015.02.011, 2015.
Guyez, A., Bonnet, S., Reimann, T., Carretier, S., and Wallinga, J.: Illuminating past river incision, sediment source and pathways using luminescence signals of individual feldspar grains (Rangitikei River, New Zealand), Earth Surf. Proc. Land., 47, 1952–1971, https://doi.org/10.1002/esp.5357, 2022.
Guyez, A., Bonnet, S., Reimann, T., Carretier, S., and Wallinga, J.: A novel approach to quantify sediment transfer and storage in rivers-testing feldspar single-grain pIRIR analysis and numerical simulations, J. Geophys. Res.-Earth, 128, e2022JF006727, https://doi.org/10.1029/2022JF006727, 2023.
Huffman, G. J., Stocker, E. F., Bolvin, D. T., Nelkin, E. J., and Tan, J.: GPM IMERG Final Precipitation L3 1 day 0.1 degree x 0.1 degree V07, edited by: Savtchenko, A., Greenbelt, MD, Goddard Earth Sciences Data and Information Services Center (GES DISC), (last access: 17 May 2023), https://doi.org/10.5067/GPM/IMERGDF/DAY/06, 2023
Jain, M., Murray, A. S., and Botter-Jensen, L.: Optically stimulated luminescence dating: how significant is incomplete light exposure in fluvial environments?, Quaternaire, 15, 143–157, https://doi.org/10.3406/quate.2004.1762, 2004.
Joordens, J. C., d'Errico, F., Wesselingh, F. P., Munro, S., De Vos, J., Wallinga, J., Ankjærgaard, C., Reimann, T., Wijbrans, J. R., Kuiper, K. F., Mücher, H. J., Coqueugniot, H., Lustenhouwer, W., Reijmer, J. J., and Roebroeks, W.: Homo erectus at Trinil on Java used shells for tool production and engraving, Nature, 518, 228–231, https://doi.org/10.1038/nature13962, 2015.
Kars, R. H., Reimann, T., Ankjærgaard, C., and Wallinga, J.: Bleaching of the post-IR IRSL signal: new insights for feldspar luminescence dating, Boreas, 43, 780–791, https://doi.org/10.1111/bor.12082, 2014.
King, G. E., Robinson, R. A. J., and Finch, A. A.: Apparent OSL ages of modern deposits from Fåbergstølsdalen, Norway: implications for sampling glacial sediments, J. Quaternary Sci., 28, 673–682, https://doi.org/10.1002/jqs.2666, 2013.
King, G. E., Sanderson, D. C., Robinson, R. A., and Finch, A. A.: Understanding processes of sediment bleaching in glacial settings using a portable OSL reader, Boreas, 43, 955–972, https://doi.org/10.1111/bor.12078, 2014.
Kreutzer, S., Burow, C., Dietze, M., Fuchs, M.C., Schmidt, C., Fischer, M., Friedrich, J., Mercier, N., Philippe, A., Riedesel, S., Autzen, M., Mittelstrass, D., Gray, H. J., and Galharret, J.: Luminescence: Comprehensive Luminescence Dating Data Analysis, R package version 0.9.23, CRAN, https://CRAN.R-project.org/package=Luminescence (last access: 30 August 2025), 2023.
Lowick, S. E., Trauerstein, M., and Preusser, F.: Testing the application of post IR-IRSL dating to fine grain waterlain sediments, Quat. Geochronol., 8, 33–40, https://doi.org/10.1016/j.quageo.2011.12.003, 2012.
Madsen, A. T., Buylaert, J. P., and Murray, A. S.: Luminescence dating of young coastal deposits from New Zealand using feldspar, Geochronometria, 38, 379–390, https://doi.org/10.2478/s13386-011-0042-5, 2011.
Maßon, L. A., Riedesel, S., Zander, A., Sontag-González, M., and Reimann, T.: Testing the applicability of standardised growth curves for chemically heterogeneous single-grain feldspars from the Atacama Desert, Chile, Quat. Geochronol., 83, 101585, https://doi.org/10.1016/j.quageo.2024.101585, 2024.
McGuire, C. and Rhodes, E. J.: Determining fluvial sediment virtual velocity on the Mojave River using K-feldspar IRSL: Initial assessment, Quaternary Int., 362, 124–131, https://doi.org/10.1016/j.quaint.2014.07.055, 2015.
Murray, A. S., Thomsen, K. J., Masuda, N., Buylaert, J. P., and Jain, M.: Identifying well-bleached quartz using the different bleaching rates of quartz and feldspar luminescence signals, Radiat. Meas., 47, 688–695, https://doi.org/10.1016/j.radmeas.2012.05.006, 2012.
Ollerhead, J., and Huntley, D. J.: Optical dating of young feldspars: the zeroing question, Ancient TL, 29, 59–63, https://doi.org/10.26034/la.atl.v29.i2, 2011.
Peng, J. and Li, B.: Single-aliquot regenerative-dose (SAR) and standardised growth curve (SGC) equivalent dose determination in a batch model using the R Package `numOSL', Ancient TL, 35, 32–53, https://doi.org/10.26034/la.atl.2017.516, 2017.
Peng, J., Dong, Z., Han, F., Long, H., and Liu, X.: R package numOSL: numeric routines for optically stimulated luminescence dating, Ancient TL, 31, 41–48, ttps://doi.org/10.26034/la.atl.2013.473, 2013.
Potts, P. J.: A handbook of silicate rock analysis, Springer Science & Business Media, https://doi.org/10.1007/978-1-4615-3270-5, 2012.
Preusser, F., Degering, D., Fuchs, M., Hilgers, A., Kadereit, A., Klasen, N., Krbetschek, M., Richter, D., and Spencer, J. Q. G.: Luminescence dating: basics, methods and applications, E&G Quaternary Sci. J., 57, 95–149, https://doi.org/10.3285/eg.57.1-2.5, 2008.
Reimann, T. and Tsukamoto, S.: Dating the recent past (< 500 years) by post-IR IRSL feldspar – Examples from the North Sea and Baltic Sea coast, Quat. Geochronol., 10, 180–187, https://doi.org/10.1016/j.quageo.2012.04.011, 2012.
Reimann, T., Tsukamoto, S., Naumann, M., and Frechen, M.: The potential of using K-rich feldspars for optical dating of young coastal sediments – a test case from Darss-Zingst peninsula (southern Baltic Sea coast), Quat. Geochronol, 6, 207–222, https://doi.org/10.1016/j.quageo.2010.10.001, 2011.
Reimann, T., Lindhorst, S., Thomsen, K. J., Murray, A. S., and Frechen, M.: OSL dating of mixed coastal sediment (Sylt, German Bight, North Sea), Quat. Geochronol., 11, 52–67, https://doi.org/10.1016/j.quageo.2012.04.006, 2012.
Reimann, T., Notenboom, P. D., De Schipper, M. A., and Wallinga, J.: Testing for sufficient signal resetting during sediment transport using a polymineral multiple-signal luminescence approach, Quat. Geochronol., 25, 26–36, https://doi.org/10.1016/j.quageo.2014.09.002, 2015.
Rhodes, E. J. and Leathard, J. A.: MET-IRSL used to track pre-depositional sediment transport history, Quat. Geochronol., 70, 101294, https://doi.org/10.1016/j.quageo.2022.101294, 2022.
Riedesel, S., Guérin, G., Thomsen, K. J., Sontag-González, M., Blessing, M., Botha, G. A., Hellers, M., Möller, G., Peffeköver, A., Sommer, C., Zander, A., and Will, M.: A direct comparison of single-grain and multi-grain aliquot luminescence dating of feldspars from colluvial deposits in KwaZulu-Natal, South Africa, Geochronology, 7, 59–81, https://doi.org/10.5194/gchron-7-59-2025, 2025.
Rittenour, T. M.: Luminescence dating of fluvial deposits: applications to geomorphic, palaeoseismic and archaeological research, Boreas, 37, 613–635, https://doi.org/10.1111/j.1502-3885.2008.00056.x, 2008.
Rodnight, H.: How many equivalent dose values are needed to obtain a reproducible distribution?, Ancient Tl, 26, 3–9, 2008.
Rodriguez Piceda, C., Scheck-Wenderoth, M., Gomez Dacal, M. L., Prezzi, C. and Strecker, M.: Lithospheric-scale 3D model of the Southern Central Andes, GFZ Data Services, https://doi.org/10.5880/GFZ.4.5.2020.001, 2020.
Sheather, S. J. and Jones, M. C.: A reliable data-based bandwidth selection method for kernel density estimation, J. R. Stat. Soc. B., 53, 683–690, https://doi.org/10.1111/j.2517-6161.1991.tb01857.x, 1991.
Silverman, B. W.: Density Estimation for Statistics and Data Analysis, 1st Edn., Routledge, https://doi.org/10.1201/9781315140919, 1998.
Sohbati, R., Murray, A. S., Buylaert, J. P., Ortuño, M., Cunha, P. P., and Masana, E.: Luminescence dating of Pleistocene alluvial sediments affected by the Alhama de Murcia fault (eastern Betics, Spain) – a comparison between OSL, IRSL and post-IR IRSL ages, Boreas, 41, 250–262, https://doi.org/10.1111/j.1502-3885.2011.00230.x, 2012.
Smedley, R. K., Duller, G. A. T., and Roberts, H. M.: Bleaching of the post-IR IRSL signal from individual grains of K-feldspar: Implications for single-grain dating, Radiat. Meas., 79, 33–42, https://doi.org/10.1016/j.radmeas.2015.06.003, 2015.
Smedley, R. K., Buylaert, J. P., and Újvári, G.: Comparing the accuracy and precision of luminescence ages for partially-bleached sediments using single grains of K-feldspar and quartz, Quat. Geochronol., 53, 101007, https://doi.org/10.1016/j.quageo.2019.101007, 2019.
Stevens, T., Marković, S. B., Zech, M., Hambach, U., and Sümegi, P.: Dust deposition and climate in the Carpathian Basin over an independently dated last glacial-interglacial cycle, Quaternary Sci. Rev., 30, 662–681, https://doi.org/10.1016/j.quascirev.2010.12.011, 2011.
Strecker, M. R., Alonso, R. N., Bookhagen, B., Carrapa, B., Hilley, G. E., Sobel, E. R., and Trauth, M. H.: Tectonics and climate of the southern central Andes, Annu. Rev. Earth Pl. Sc., 35, 747–787, https://doi.org/10.1146/annurev.earth.35.031306.140158, 2007.
Thiel, C., Buylaert, J. P., Murray, A., Terhorst, B., Hofer, I., Tsukamoto, S., and Frechen, M.: Luminescence dating of the Stratzing loess profile (Austria) – Testing the potential of an elevated temperature post-IR IRSL protocol, Quaternary Int., 234, 23–31, https://doi.org/10.1016/j.quaint.2010.05.018, 2011.
Thomsen, K. J., Murray, A. S., Jain, M., and Bøtter-Jensen, L.: Laboratory fading rates of various luminescence signals from feldspar-rich sediment extracts, Radiat. Meas., 43, 1474–1486, https://doi.org/10.1016/j.radmeas.2008.06.002, 2008.
Wallinga, J.: Optically stimulated luminescence dating of fluvial deposits: a review, Boreas, 31, 303–322, https://doi.org/10.1111/j.1502-3885.2002.tb01076.x, 2002.
Yi, S., Buylaert, J. P., Murray, A. S., Lu, H., Thiel, C., and Zeng, L.: A detailed post-IR IRSL dating study of the Niuyangzigou loess site in northeastern China, Boreas, 45, 644–657, https://doi.org/10.1111/bor.12185, 2016.
Zhang, J., Guralnik, B., Tsukamoto, S., Ankjærgaard, C., and Reimann, T.: The bleaching limits of IRSL signals at various stimulation temperatures and their potential inference of the pre-burial light exposure duration, Front. Earth Sci., 10, 933131, https://doi.org/10.3389/feart.2022.933131, 2023.
Zhao, H. and Li, S. H.: Internal dose rate to K-feldspar grains from radioactive elements other than potassium, Radiat. Meas., 40, 84–93, https://doi.org/10.1016/j.radmeas.2004.11.004, 2005.